
Figure 2.
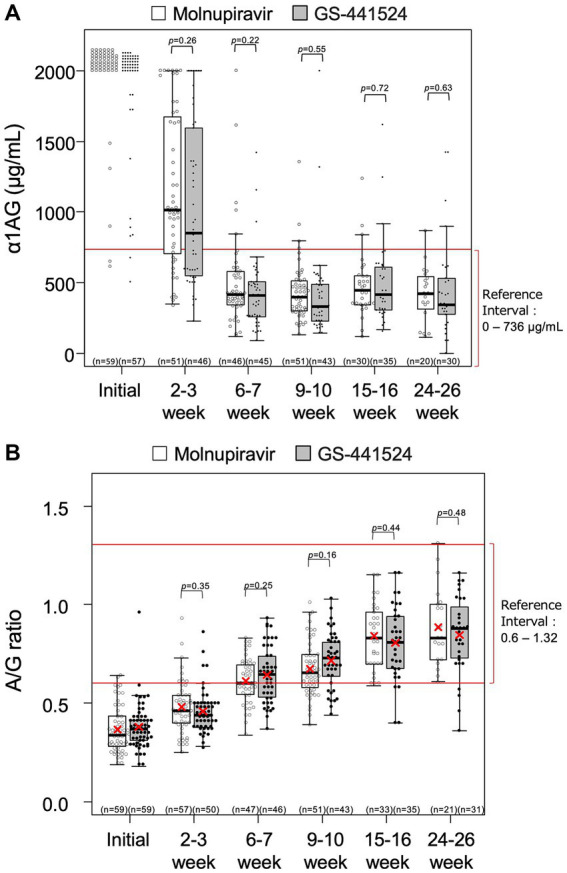
Levels of (A) α1-acid glycoprotein (α1AG) and (B) albumin-to-globulin (A/G) ratio over time. Each rectangle represents the interquartile range and the horizontal line is the median. Vertical lines indicate the statistical range where the minimum is calculated as Q1–1.5*IQR and the maximum is calculated as Q3 + 1.5*IQR, where IQR is interquartile range. The red X indicates mean, where calculated. Descriptive statistics for α1AG level at week 0 were not calculated because most of the values were > 2000 μg/mL.