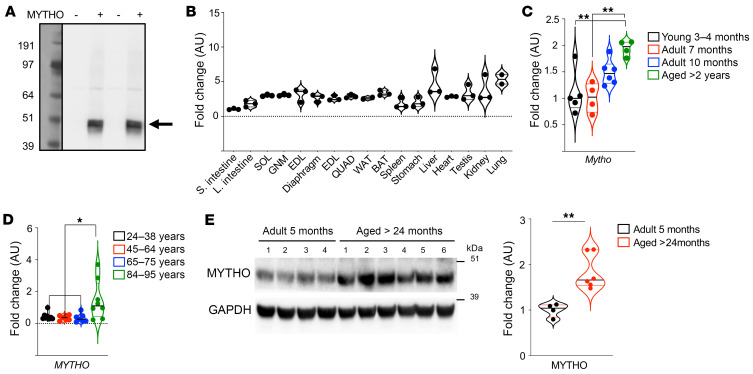
Figure 1. C16orf70 encodes a protein named MYTHO that is expressed in different tissues and upregulated in aging.
(A) PBI-eGFP/3xFlag-MYTHO vector or PBI-eGFP/3xFlag–empty vector was transfected into HEK293A cells. 3×FLAG-MYTHO expression was observed using an anti-FLAG antibody. The blot shown in the image represents the results of 4 independent transfections. (B) Quantitative RT-PCR of Mytho in different organs and muscles from 5-month-old male mice. mRNA expression was calculated by the ΔCt method and expressed as fold increase from the tissue where Mytho is less expressed (small intestine). SOL, soleus muscle; GNM, gastrocnemius muscle; EDL, extensor digitorum longus muscle; TA, tibialis anterior muscle; QUAD, quadriceps muscle; WAT, white adipose tissue; BAT, brown adipose tissue. n = 3 for all tissues, n = 2 only for WAT and lung. (C) Quantitative real-time PCR of Mytho from mice of different ages (3–4 months, n = 5; 7 months, n = 4; 10 months, n = 6; and >2 years old, n = 4). Expression was normalized to that of Gapdh and is expressed as fold increase (1-way ANOVA with Tukey’s multiple-comparison test). (D) Quantitative real-time PCR of MYTHO in muscle biopsies from patients of different ages: 24–38 years old (n = 8), 45–64 years old (n = 7), 67–75 years old (n = 7), and 84–95 years old who underwent surgery for hip replacement (n = 8). All data were normalized to GAPDH and are expressed as fold increase from the 24- to 38-year-old control group (1-way ANOVA with Tukey’s multiple-comparison test). (E) Immunoblot of homogenates from GNM muscle from 5-month-old mice (n = 4) and >24-month-old (n = 6) mice. Anti-C16orf70 antibody was used to detect MYTHO endogenous protein. Normalization was performed using GAPDH and data are expressed as fold increase (2-tailed Student’s t test). All bars indicate SEM. *P < 0.05; **P < 0.01.

