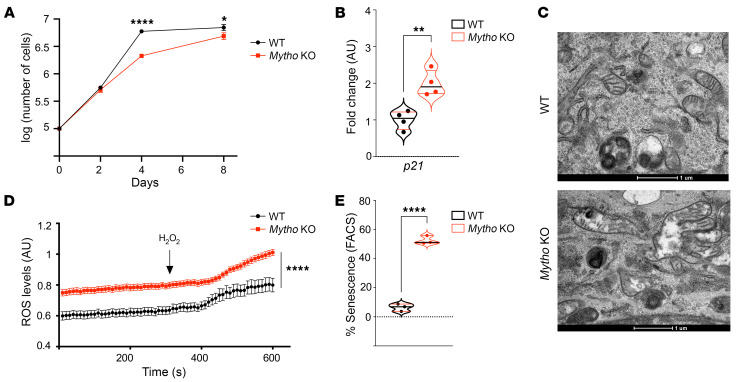
Figure 3. Mytho depletion induces cellular senescence.
(A) The graph shows the logarithm (log) of total number of cells measured at 2 days, 4 days, and 8 days after seeding. Cellular confluence was reached at 4 and 8 days in control and Mytho-deficient cells, respectively (N = 3) (2-tailed Student’s t test). (B) Quantitative real-time PCR of p21 from WT and Mytho-KO C2C12 cells normalized to Gapdh and expressed as fold increase (N = 3) (2-tailed Student’s t test). (C) Representative electron microscopy images of the cytoplasm of WT (top) and Mytho-KO (bottom) C2C12 cells. Abnormal swollen mitochondria are often found in KO cells. Scale bars: 1 μm. (D) Mt-roGFP fluorescence was measured in single cells (n = 30/condition; N = 2). Arrow indicates the addition of H2O2. (E) Percentage senescence in cells measured by FACS after WT and Mytho-KO C2C12 cells were incubated with CellEvent Green Senescence Probe (Thermo Fisher Scientific) (n = 3) (multiple unpaired t test). N = number of independent experiments; n = total number of individuals. All bars indicate SEM. *P < 0.05, **P < 0.01, ****P < 0.0001.

