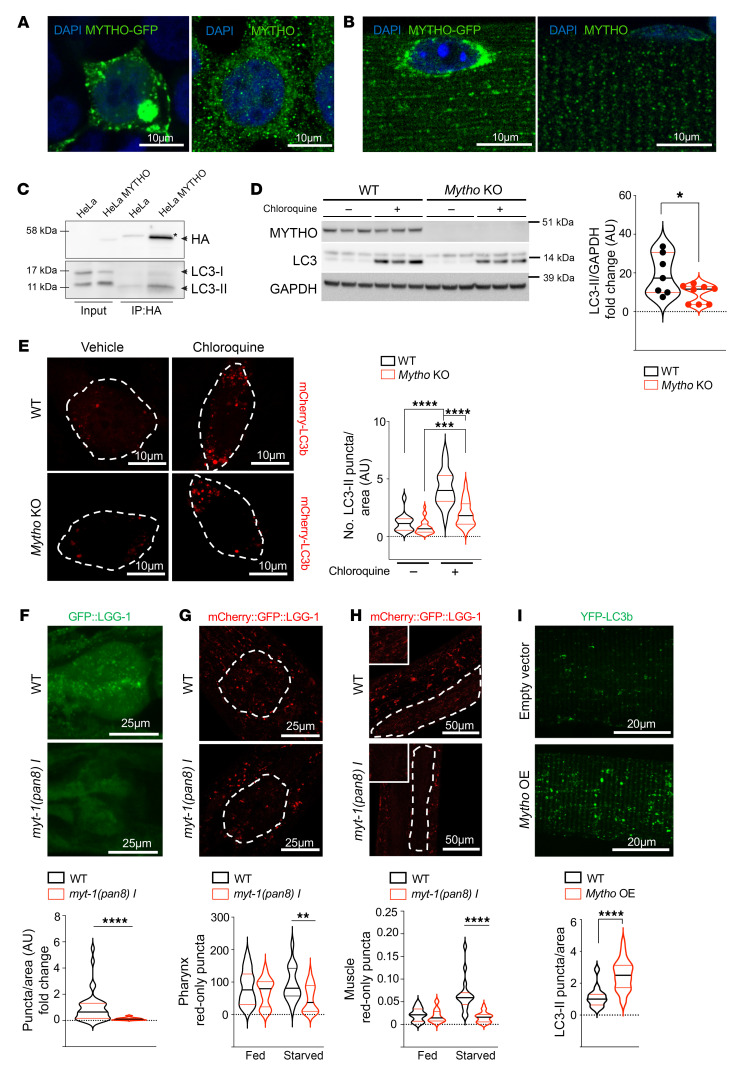
Figure 5. Depletion of Mytho reduces autophagic flux in vitro and in vivo.
(A) Left: Representative images of HEK293 cells transfected with MYTHO-GFP. Right: Representative image of endogenous MYTHO. Scale bars: 10 μm. (B) Left: FDB muscles transfected with MYTHO-GFP. Right: Endogenous Mytho in FDB fibers. Scale bars: 10 μm. (C) Endogenous HA-tagged Mytho coimmunoprecipitates with LC3B. The asterisk (*) indicates a nonspecific band. (D) LC3 lipidation was analyzed by immunoblot in WT and Mytho-KO C2C12 cells treated or not with chloroquine. LC3-II band was normalized to GAPDH (n = 8) (2-tailed Student’s t test). (E) Left: Representative fluorescence images of WT and Mytho-KO C2C12 cells transfected with Cherry-LC3B and treated with chloroquine or vehicle. Scale bars: 10 μm. Right: Quantification of LC3 puncta/area of the cell in each condition is shown (n > 15 cells/condition) (1-way ANOVA with Tukey’s multiple-comparison test). (F) Top: Representative fluorescence images of GFP:LGG-1 puncta in the posterior bulb of the pharynx of N2 (WT) and myt-1(pan8) I worms. Scale bar: 25 μm. Bottom: Autophagosomal pool quantification in WT (n = 26) and myt-1(pan8) I (n = 20) worms (N = 3) (2-tailed Student’s t test). (G and H) Top: Representative fluorescence images of mCherry:LGG-1 puncta in the posterior bulb of the pharynx (G) and in body wall muscle (H) of N2 (WT) and myt-1(pan8) I worms. Scale bars: 25 μm (G) and 50 μm (H). Bottom: Relative quantification of mCherry:LGG-1 puncta in basal condition (Fed) and after 24-hour starvation (Starved) in M9 buffer. WT Fed (n = 14), myt-1(pan8) I Fed (n = 22), WT STV 24 h (n = 17), myt-1(pan8) I STV 24 h (n = 27); N = 2 (2-tailed Student’s t test). (I) Top: Representative fluorescence images of single fibers from FDB muscle transfected with YFP-LC3/3xFlagMYTHO or YFP-LC3/Flag–empty vector in basal condition. Scale bars: 20 μm. Bottom: Quantification of LC3 puncta in more than 12 fibers (2-tailed Student’s t test). All bars indicate SEM. *P < 0.05; **P < 0.01; ***P < 0.001; ****P < 0.0001. N = number of independent experiments; n = number of cells/samples.

