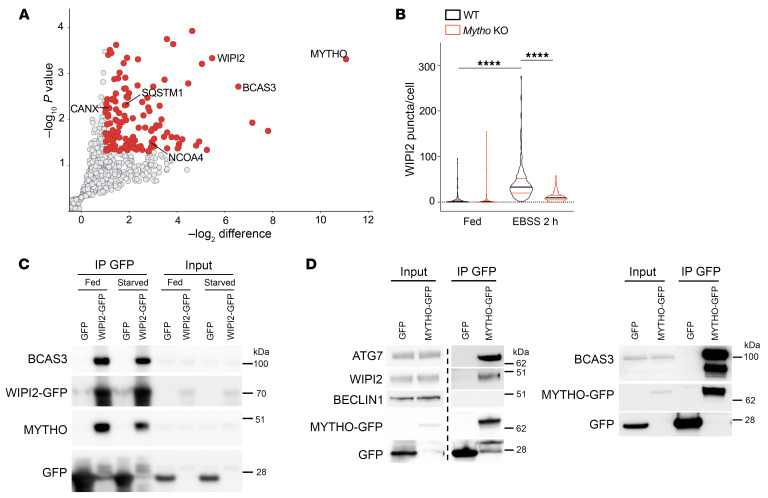
Figure 6. MYTHO interacts with autophagic proteins.
(A) Mass spectrometry analysis of immunoprecipitated endogenous HA-tagged MYTHO. Significant autophagy-related proteins are shown in the graph. (B) Quantification of WIPI2 puncta in Fed and starved (2 hours with Earle’s balanced salt solution [EBSS]) conditions in WT and Mytho-KO C2C12 cells in N = 3. Fed WT (n = 141); Fed Mytho-KO (n = 144), EBSS 2 h WT (n = 139); EBSS 2 h Mytho-KO (n = 172). Bars indicate SEM. ****P < 0.0001 (1-way ANOVA with Tukey’s multiple-comparison test). (C) HEK293 cells transfected with WIPI2-GFP or GFP were immunoprecipitated with GFP-TRAP. The quantification of N = 3 (normalized by input) is shown in Supplemental Figure 9E. (D) HEK293 cells transfected with MYTHO-GFP or GFP were immunoprecipitated. Endogenous WIPI2, ATG7, and BCAS3 were immunoblotted. In the blot on the left, lanes were run on the same gel but were noncontiguous. The quantification of N = 3 (normalized by input) is represented in Supplemental Figure 9F. N = number of independent experiments; n = number of cells/samples.

