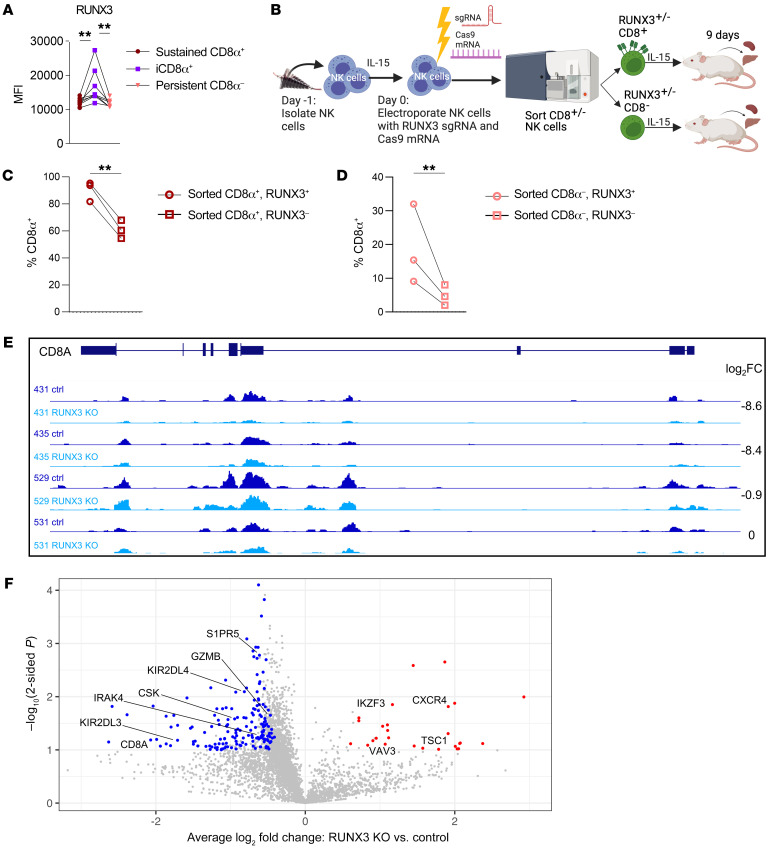
Figure 5. RUNX3 regulates CD8α expression.
(A) MFI of RUNX3 on day 6 within the indicated cell populations cultured in 1 ng/mL IL-15. n = 5 donors and 3 independent experiments. (B–D) NK cells were electroporated with RUNX3 sgRNA and Cas9 mRNA, cultured in vitro for 48 hours, and then sorted on the basis of CD8α expression. NSG mice were injected i.v. with sorted CD8α+/– control or RUNX3-KO cells and supported with i.p. rhIL-15 for 9 days. (B) Experimental schema. (C and D) Percentage of human NK cells in the liver expressing CD8α within RUNX3+ or RUNX3– cell populations that were originally sorted as (C) CD8α+ or (D) CD8α–. n = 3 donors and 2 independent experiments. Data represent the mean ± SEM. **P < 0.01, by (A) repeated-measures 1-way ANOVA and (C and D) ratio-paired, 2-tailed Student’s t test. (E and F) NK cells were electroporated with control or RUNX3 gRNA and Cas9 mRNA, cultured in 5 ng/mL IL-15 for 9 days, and assessed for H3K27ac abundance using CUT&TAG. (E) Integrative Genomics Viewer (IGV) tracks showing H3K27ac peaks within the CD8A locus for control (ctrl) and RUNX3-KO donor pairs, with the log2 FC for each donor pair for the entire CD8A locus shown. (F) Volcano plot showing the average log2 FC and –log10 P value, determined by matched, paired, 2-tailed Student’s t test, for donor-matched RUNX3-KO versus control H3K27ac signal for gene loci. Genes in highlighted in red had significantly increased H3K27ac signal, and genes in blue had significantly decreased H3K27ac signal in RUNX3-KO cells with log2 FC cutoffs of absolute (0.5) or higher for at least 3 of 4 donors. We filtered genes with P < 0.05 using the results of 1-sided Student’s t tests (peaks lost/lower in KO or peaks gained/higher in KO), a log2 fold change ≤ -0.5 or ≥ 0.5, respectively) in at least 3 of 4 donors, for genes expressed in NK cells. n = 4 donors and 2 independent experiments.

