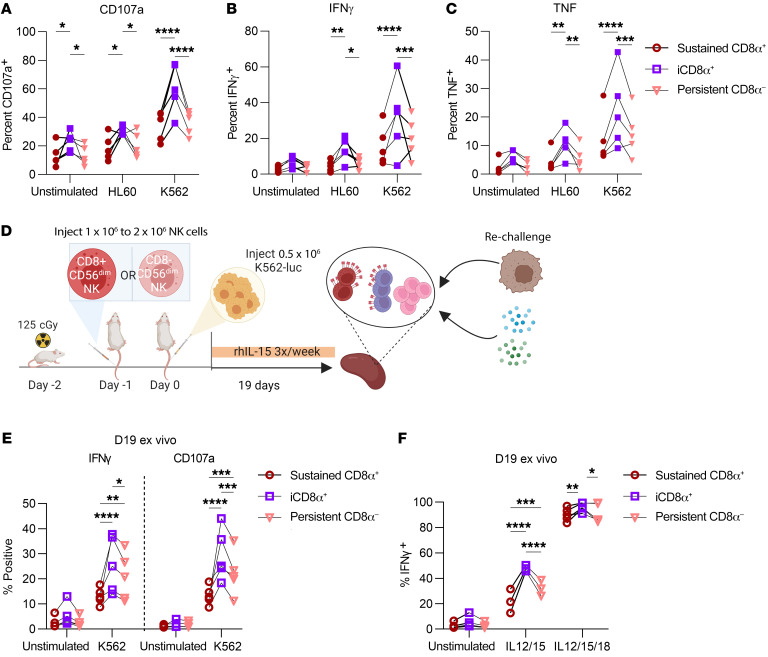
Figure 8. Induction of CD8α corresponds to enhanced in vitro and ex vivo responses to tumors.
(A–C) Primary human NK cells were sorted into CD8α+CD56dim and CD8α–CD56dim populations and cultured in vitro in 5 ng/mL IL-15 for 6 days. NK cells were stimulated with HL60 or K562 leukemic cell lines at a 1:1 effector/target ratio for 6 hours, with GolgiPlug/Stop for the last 5 hours. Data are shown as the percentage of NK cells expressing (A) CD107a, (B) IFN-γ, or (C) TNF within the indicated cell subsets. n = 5 donors and 3 independent experiments. (D–F) CD56dim NK cells were sorted on the basis of CD8α expression, and approximately 1 × 10⁶ to 2 × 10⁶ CD8α+CD56dim or CD8α–CD56dim NK cells were injected i.v. into the tail vein of NSG mice (day –1). The next day (day 0), 0.4 × 10⁶ to 0.5 × 10⁶ K562-CBR cells were injected i.v. into the tail vein. NK cells were supported with i.p. rhIL-15 three times/week. (D) Experimental schema. (E and F) On day 19, splenocytes were isolated from NK cell–treated mice and stimulated ex vivo with (E) K562s (10:1 splenocyte/K562 ratio) or (F) cytokines for 6 hours (20 ng/mL IL-12; 100 ng/mL IL-15; 100 ng/mL IL-18) with GolgiPlug/Stop in the last 5 hours. The percentage of NK cells positive for the indicated marker and gated within the indicated cell subsets is shown. n = 5 donors and 3 independent experiments. Data represent the mean ± SEM. *P < 0.05, **P < 0.01, ***P < 0.001, and ****P < 0.0001, by 2-way ANOVA with Holm-Šídák correction for multiple comparisons.

