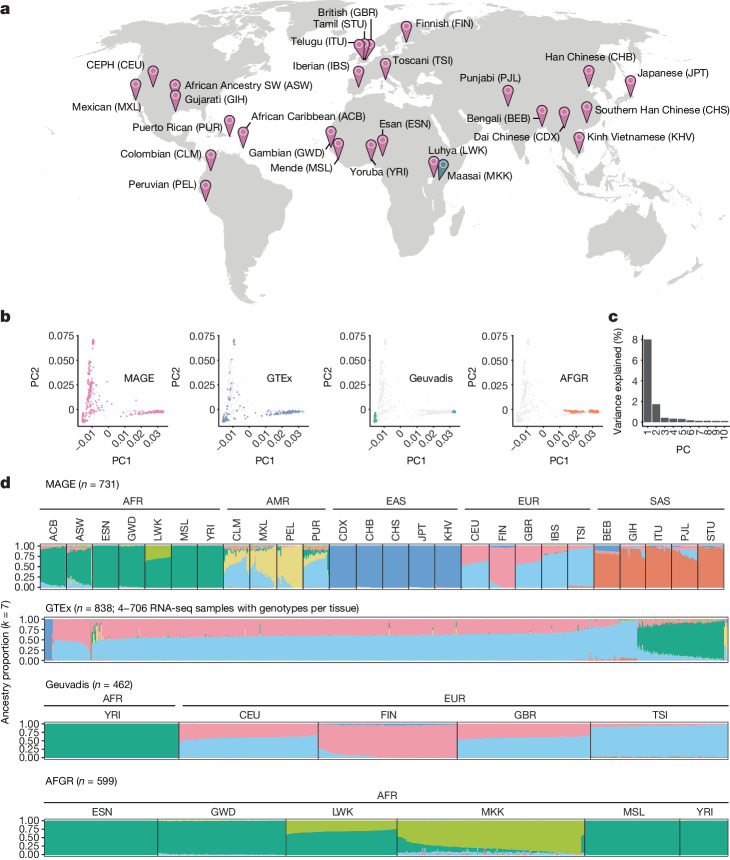
Fig. 1. A globally diverse transcriptomics dataset.
a, RNA-seq data were generated from LCLs from 731 individuals from the 1KGP6, roughly evenly distributed across 26 populations and 5 continental groups. Populations included in MAGE are indicated in pink, whereas the Maasai population is in blue as it is present in the AFGR17 dataset (based on sequencing of HapMap57 cell lines) but not in the 1KGP or MAGE. Full population descriptors can be found at https://catalog.coriell.org/1/NHGRI/About/Guidelines-for-Referring-to-Populations. b, Genotype principal component 1 (PC1) and PC2 comparing MAGE to other large studies with paired RNA and whole-genome sequencing data. Samples from the specified study (that is, MAGE, Geuvadis, GTEx and AFGR) are depicted with coloured points, whereas samples from other studies are depicted with grey points in each respective panel. c, Proportion of variance explained by the first ten PCs. d, ADMIXTURE58 results displaying proportions of individual genomes (columns) attributed to inferred ancestry components. For MAGE, Geuvadis4 and AFGR, samples are stratified according to population and continental group labels from the respective source projects, whereas GTEx26 does not include population labels. A subset of 1KGP samples are present across multiple RNA-seq studies and therefore appear in multiple panels, but these samples were not duplicated within the input to ADMIXTURE. Ancestry components are modelling constructs that do not directly correspond to true ancestral populations, and the results of ADMIXTURE analysis strongly depend on sampling characteristics of the input data. Although k = 7 minimizes the cross-validation error within this combined dataset (Supplementary Fig. 1), alternative choices of k reflect structure at different scales (Supplementary Fig. 2). Map in a adapted from the US CIA World Factbook, 2005.

