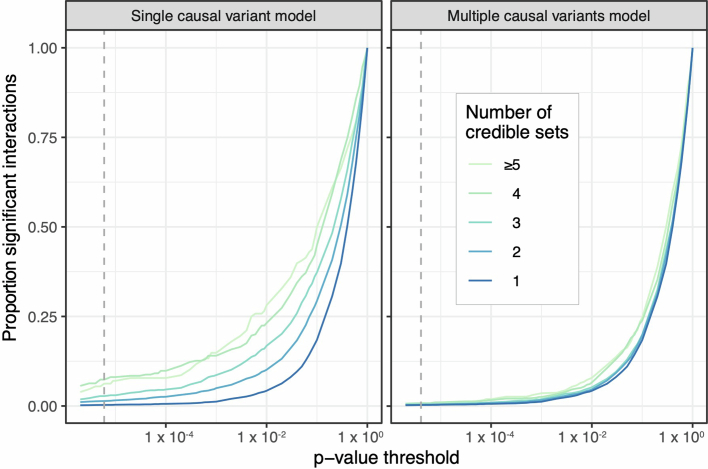
Extended Data Fig. 7. Results of eQTL genotype-by-principal component interaction test.
Analogous to Fig. 5f, the number of significant genotype-by-principal component interactions at varying p-value thresholds (dashed line denotes Bonferroni threshold) for a model that considers a single causal variant for each gene (left panel) versus a model that jointly considers multiple potential causal variants per gene (right panel). Genotype-by-principal component interactions were included for each of the top 5 global genotype principal components. Results are stratified by the number of credible sets for the gene (from one to five or greater). As in Fig. 5f, p-values are one-tailed and are obtained from an F-test comparing a model with an interaction term to one without.

