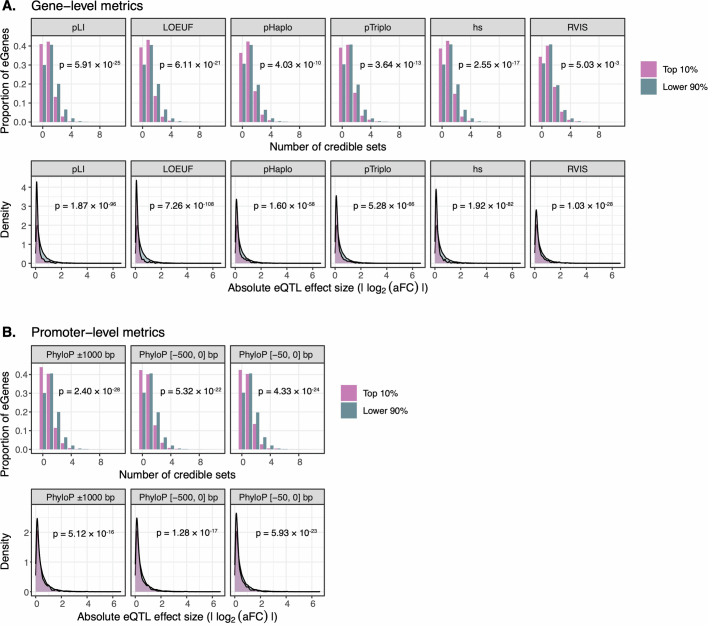
Extended Data Fig. 3. Evidence of negative selection on expression-altering variation across a range of mutational constraint metrics.
(A) Top row: number of credible causal sets for genes in (pink) and outside (blue) the top decile of various gene-level constraint metrics (pLI, LOEUF, pHaplo, pTriplo, hs, RVIS) obtained from the literature. P-values are two-tailed and based on quasi-Poisson generalized linear models that include mean expression level as a covariate. Bottom row: effect sizes (|log2(aFC)|) of lead eQTLs within (pink) and outside (blue) the same categories. P-values are two-tailed and based on Wilcoxon rank sum tests. (B) Same as panel A, but for mean PhyloP scores summarizing conservation among genome sequence alignments of 447 mammals within putative promoter elements, defined based on intervals around the TSS ([−1000, 1000] bp, [−500, 0] bp, [−50, 0] bp).

