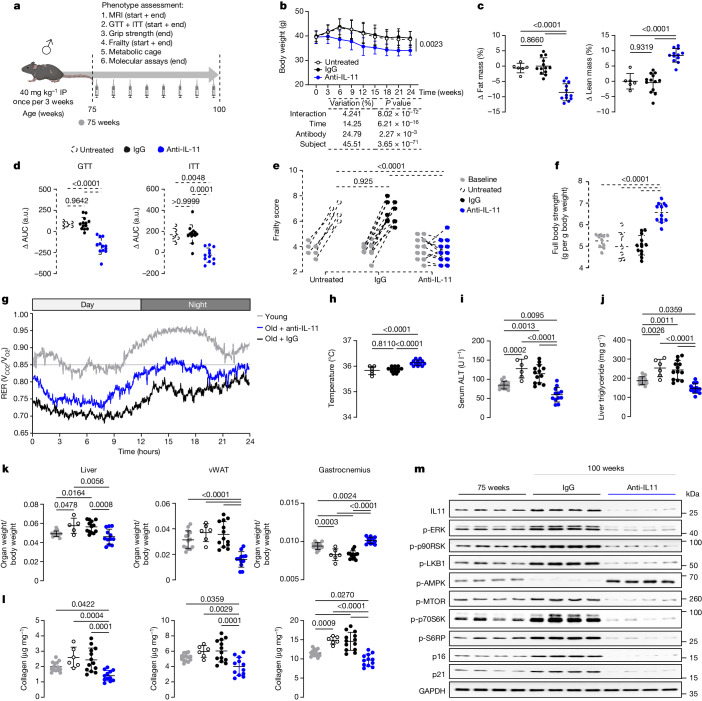
Fig. 3. Therapeutic inhibition of IL-11 reduces age-associated metabolic dysfunction, pathogenic signalling and sarcopenia in male mice.
a, Schematic of anti-IL-11 (X203) therapeutic dosing experiment in old male mice for experiments shown in b–m. Mice were either aged naturally (untreated) or given either X203 or an IgG control antibody (40 mg kg−1, every 3 weeks) starting from 75 weeks of age for a duration of 25 weeks. Created with BioRender.com. b, Body weights across time. c,d, Changes (Δ) in fat and lean mass percentage (c) and area under the curve (AUC) of GTT and ITT (d) (values at endpoint (100-week-old) − values at starting point (75-week-old)). a.u., arbitrary units. e, Frailty scores at start and endpoint. Data are shown as values recorded at starting and endpoint. f, Full body grip strength. g, RER in young (14-week-old) and IgG or X203-treated old (81-week-old) mice, 6 weeks after IgG or X203 administration was started (n = 10 per group). h–j, Body temperatures (h), serum ALT (i) and liver triglycerides (j). k,l, Indexed weights of (k) and total collagen content (by hydroxyproline assay) in (l) liver, gastrocnemius and vWAT. m, Western blot showing activation status of ERK1/2, p90RSK, LKB1, AMPK, mTOR, p70S6K, S6RP and protein expression levels of IL-11, p16, p21 and GAPDH in vWAT (n = 6 per group). Western blots of total protein are presented in Extended Data Fig. 7i. b–d,f,h–l, Data are mean ± s.d. 75-week-old control: n = 10 (f), n = 14 (i–l); untreated 100-week-old: n = 6 (except for k (liver), n = 5); IgG-treated 100-week-old: n = 13; X203-treated 100-week-old: n = 12. Two-way repeated measures ANOVA with Sidak’s correction (b); one-way ANOVA with Tukey’s correction (c,d (GTT), e,f,h–l); one-way ANOVA with Kruskal–Wallis correction (d (ITT)). For gel source data, see Supplementary Fig. 1.

