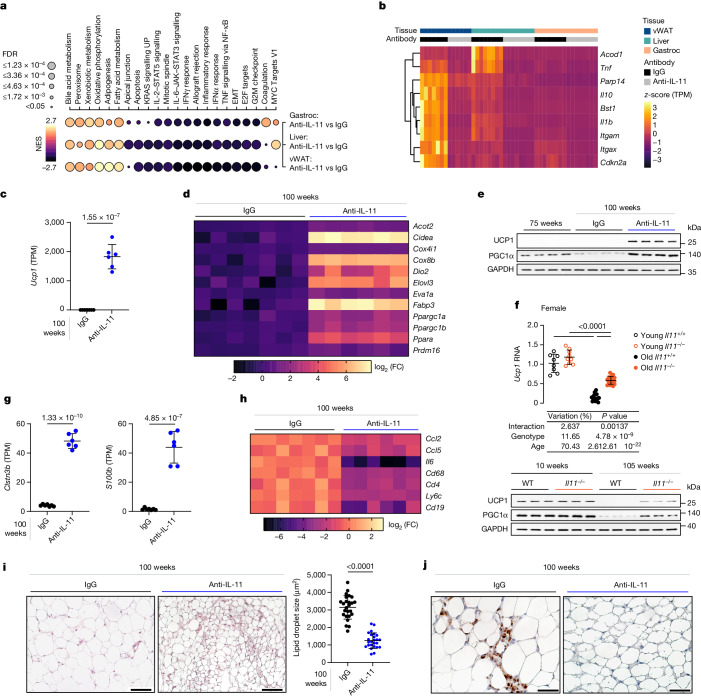
Fig. 4. Anti-IL-11 reduces vWAT inflammation and reactivates an age-repressed thermogenic programme.
a–e,g–j, Data for therapeutic experiments in old male mice as shown in Fig. 3a. a, Bubble map showing hallmark gene set enrichment analysis for differentially expressed genes in the vWAT, liver and gastrocnemius of mice receiving anti-IL-11 therapy compared with IgG. Colour represents normalized enrichment score (NES); black represents negative NES, indicating down-regulation of the gene set; yellow represents positive NES, suggesting up-regulation. Dot size indicates significance (the larger the dot, the smaller the adjusted P value). EMT, epithelial–mesenchymal transition. b, Heat map of row-wise scaled transcripts per million (TPM) values of senescence genes in vWAT, liver, gastrocnemius. c, Abundance of Ucp1 reads in vWAT. d, log2-transformed fold change heat map of beiging genes in vWAT from IgG- or anti-IL-11-treated 100-week-old mice, based on RNA-seq. e, Western blot of UCP1, PGC1α and GAPDH expression in vWAT (n = 6 per group). f, Relative expression levels of Ucp1 mRNA (young wild-type, n = 8; young Il11−/−, n = 9; old wild-type, n = 16; old Il11−/−, n = 18) as well as UCP1 and PGC1α protein expression (n = 6 per group) in vWAT isolated from young and old female wild-type and Il11−/− mice. g,h, Abundance of Clstn3b and S100b reads (g) and log2-transformed fold change heat map of pro-inflammatory markers (from RNA-seq) (h) in vWAT. i, Haematoxylin and eosin-stained vWAT (scale bars, 100 µm) and quantification of lipid droplet size (mean of lipid droplet area, n = 25 (5 fields per mouse from 5 mice per group)). j, Immunohistochemistry staining of CD68 in vWAT (scale bars, 50 µm). a–d,f–h, Liver and gastrocnemius (n = 8 per group), vWAT IgG, n = 7; vWAT anti-IL-11, n = 6. c,f,g,i, Data are mean ± s.d. Two-tailed Student’s t-test (c,g,i); two-way ANOVA with Sidak’s correction (f). For gel source data, see Supplementary Fig. 1. Scale bars: 100 μm (i), 50 μm (j).

