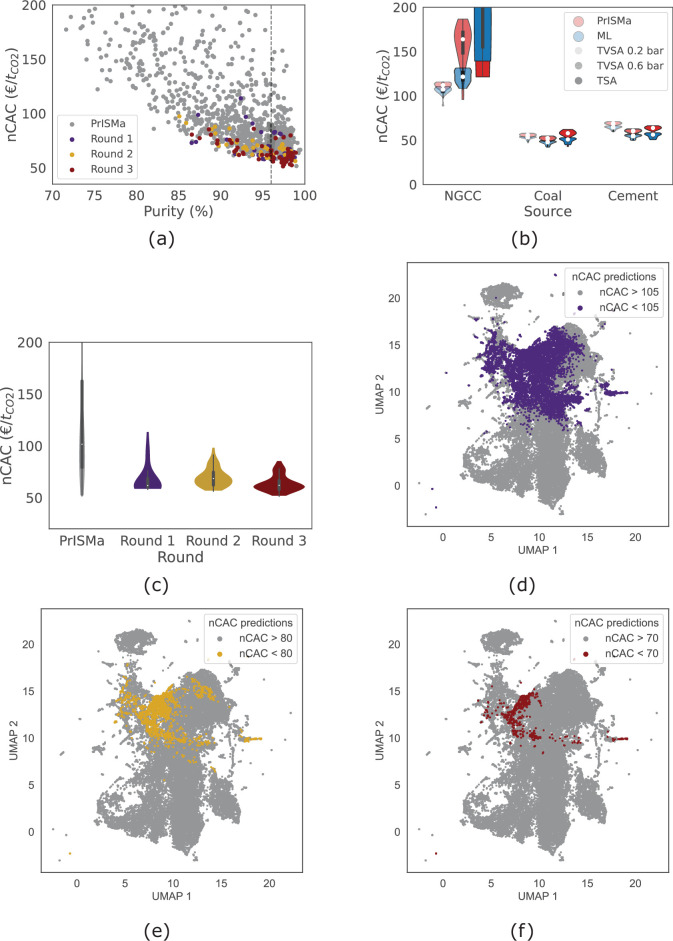
Extended Data Fig. 6. Iterative material discovery.
The PrISMa platform was used to train a series of ML models to predict an nCAC below a set of thresholds (105, 80, and 70 €t−1CO2) for the cement Case Study in the UK (TVSA, 0.6 bar). (a) shows the nCAC versus purity for the different rounds. (b) shows how these materials perform for the other Case Studies. (c) shows the distribution of the nCAC per round. (d)–(f) visualize the screening of the chemical space through dimensionality reduction (UMAP embedding, see Supplementary Information Section 11). Each data point corresponds to one MOF. In (d)-(f), the colored dots are MOFs with an nCAC better than the threshold and the 30,000 grey dots are from the large database.

