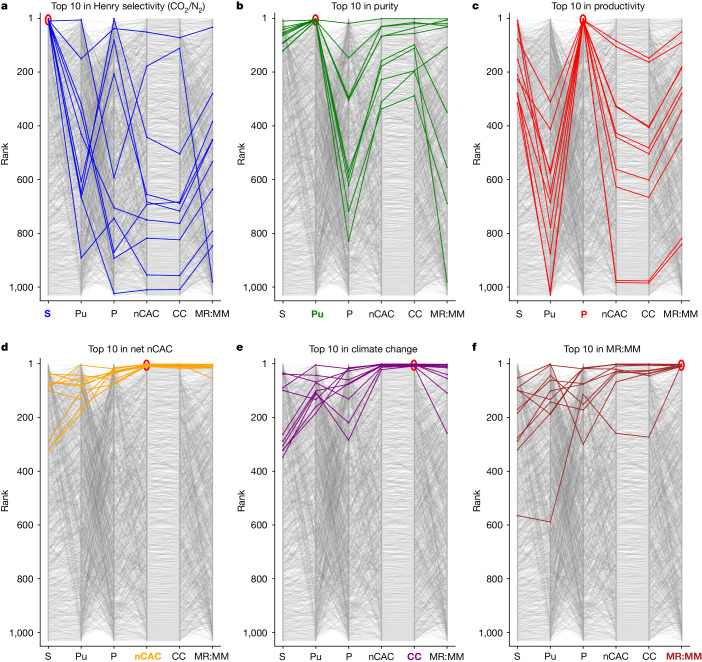
Fig. 3. Comparison of materials ranking for a TVSA carbon-capture process at 0.6 bar added to a cement plant in the UK.
Rankings according to Henry selectivity (S), purity (Pu), productivity (P), nCAC, climate change (CC) and MR:MM for a TVSA carbon-capture process added to a cement plant in the UK. In these graphs, the top-performing material is ranked number one. Coloured lines represent the top ten performers for the six reference KPIs. The same colour is used to highlight the KPI of interest. Every line illustrates how the ranking of a specific material (y axis) changes across all other KPIs (x axis). Our visualization tool25 gives an interactive version of this graph.

