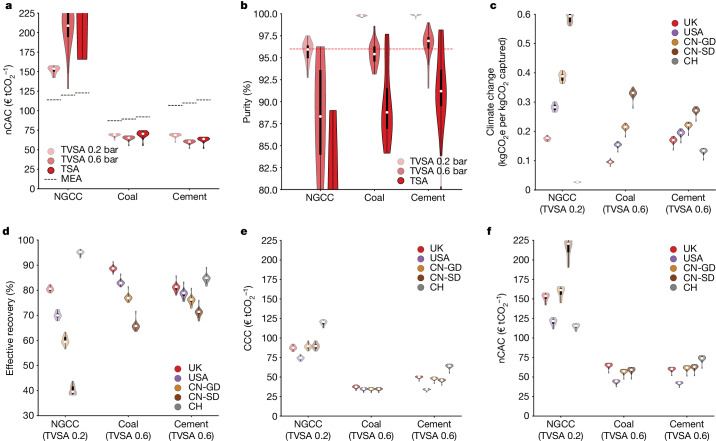
Fig. 4. Comparison of process configurations and regions.
This analysis of the stakeholders’ perspectives focuses on the 20 materials with the lowest nCAC. In these violin plots, the white circle gives the median, which we use as a (conservative) estimate of the performance. The bottom of the violin represents a few materials with an even better performance. The width indicates the number of structures with a particular y value and the thick black bar contains 50% of the structures. a, The nCAC jointly with the MEA benchmark (black dashed lines). b, The purity for three CO2 sources depending on the technologies (TSA and TVSA with two vacuum levels 0.2 bar and 0.6 bar) jointly with the required purity of the CO2 sink (red dashed line). c,d, The climate change (c) and effective recovery (d) for the five regions. e,f, The CCC (e) and the nCAC (f) for the five regions. CN-GD, China Guangdong region; CN-SD, China Shandong region; CH, Switzerland. See Supplementary Information Section 8 for the data.

