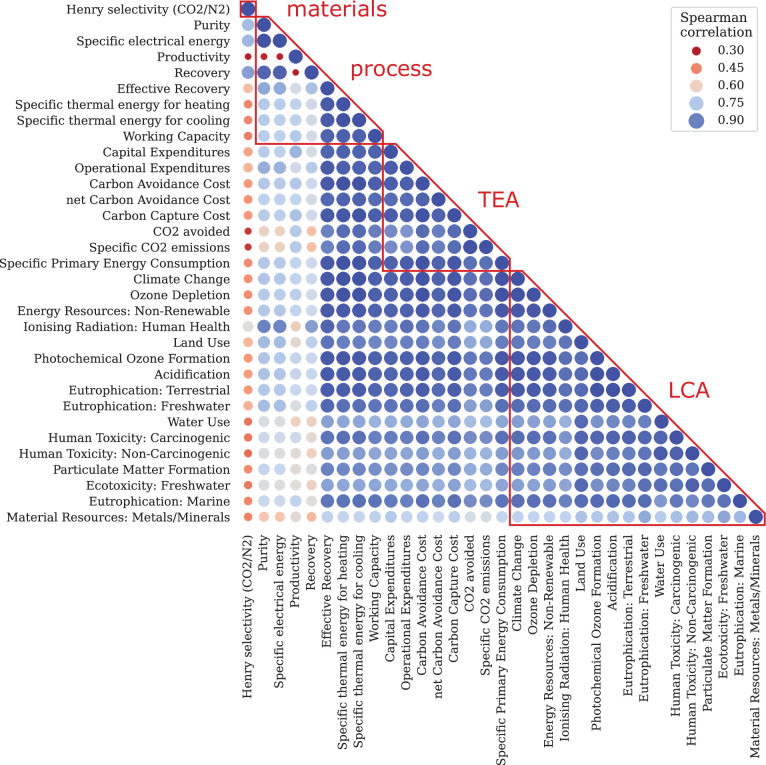
Extended Data Fig. 1. Spearman’s rank correlation matrix for the cement case in the UK with TVSA process at 0.6 bar.
Spearman’s rank correlation matrix of the rankings considering one material KPI, eight process KPIs, eight TEA KPIs, and 16 LCA KPIs. Dark blue represents very strong correlations, while dark red represents lower correlations. The size of the circle is proportional to the absolute value of the correlation. The diagonal circles in the matrix have, by definition, a Spearman’s correlation coefficient of 1. A more detailed description can be found in Supplementary Information Section 7.

