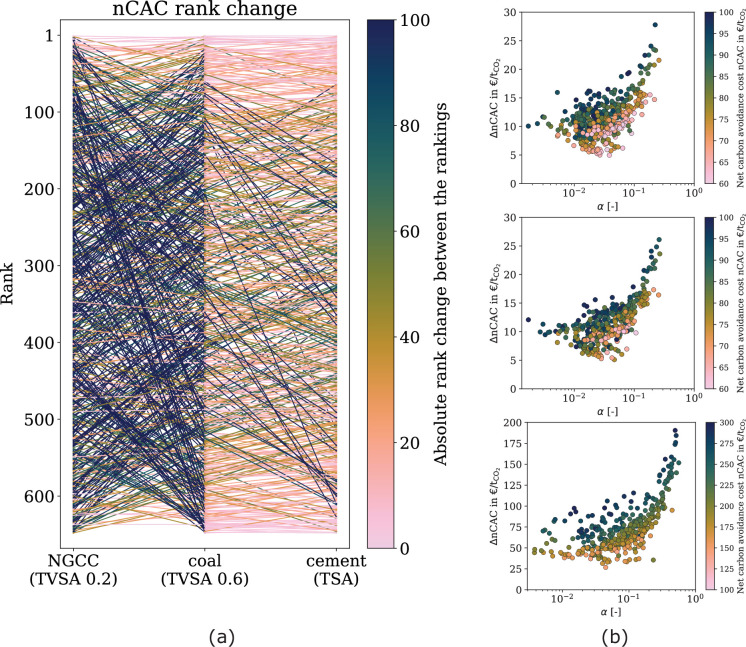
Extended Data Fig. 4. Ranking of materials and comparison between wet and dry flue gasses.
(a) Ranking of materials for NGCC power plant (TVSA at 0.2 bar), coal power plant (TVSA at 0.6 bar), and cement plant (TVSA at 0.6 bar). The materials are ranked using the preferred technology according to the Net Carbon Avoidance Cost (nCAC). The color coding of the lines shows the number of ranks a material change ranking. (b) Scatter plots of the increase in nCAC from dry to wet conditions as a function of the fraction of bed that is moisture-loaded. (top) Cement plant (TVSA at 0.6 bar), (middle) coal power plant (TVSA at 0.6 bar), (bottom) NGCC power plant (TVSA at 0.2 bar).

