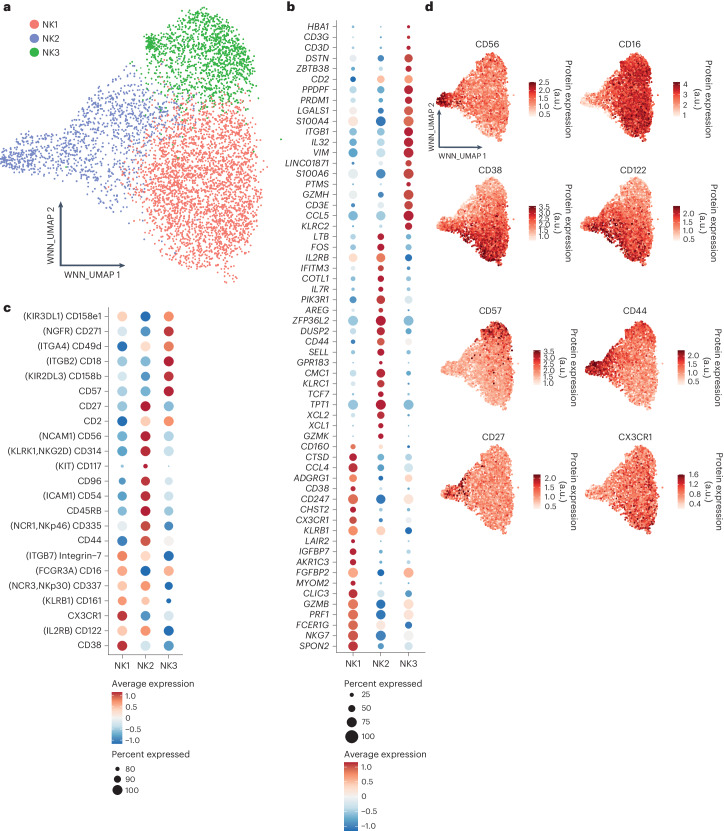
Fig. 1. CITE-seq analysis reveals three prominent subsets of peripheral blood NK cells in healthy individuals.
Based on dataset 5. a, WNN and UMAP (WNN_UMAP) visualization of NK cells sorted from healthy human blood with clusters identified by unsupervised hierarchical clustering (based on scRNA-seq and expression of 228 surface proteins). b, Dot plot of the 20 most distinguishing genes expressed for the three major subsets of human blood NK cells. Gene expression was analyzed using the using the two-sided Wilcoxon rank-sum test with Bonferroni adjustment. Ribosomal genes and mitochondrial genes were removed for clarity. The color indicates the Z-score scaled gene expression levels. c, Dot plot of the most distinguishing proteins expressed for the three major subsets of human blood NK cells. Protein expression was analyzed using the two-sided Wilcoxon rank-sum test with Bonferroni adjustment. Alternative protein names are shown in parentheses. The color indicates the Z-score scaled protein expression levels. d, WNN_UMAP visualization of the surface expression of the major discriminating proteins expressed at the surface of NK1, NK2 and NK3 cells. a.u., arbitrary units.

