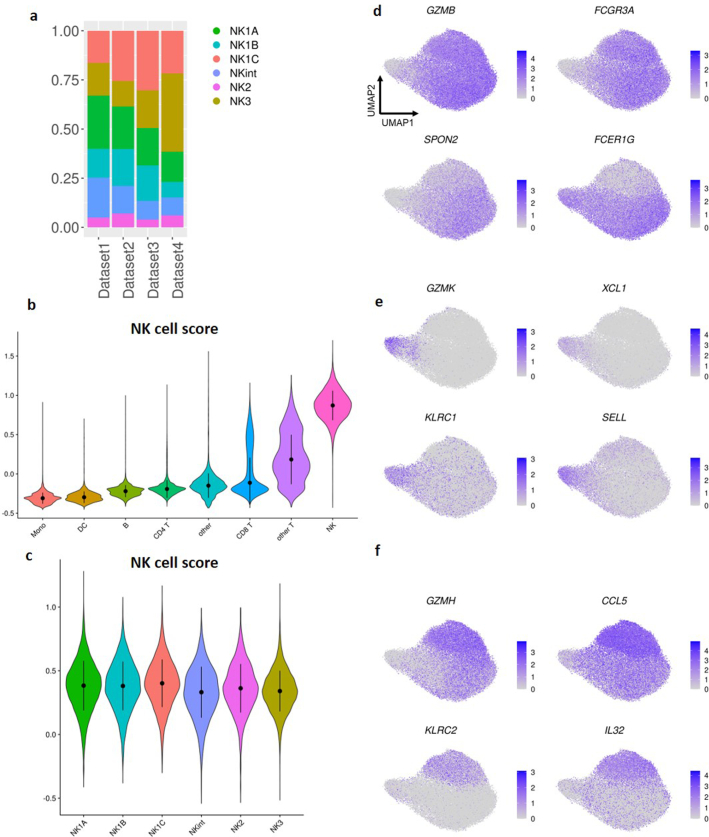
Extended Data Fig. 4. The NK cells in human blood can be divided into six subgroups.
a,c and d-f: Based on Based on Dataset 1,2,3 and 4a b: Based on Dataset 5. a, Bar graph showing the proportion of cells within each cluster in the datasets. (n= 13 samples) b, Violin plot of the scoring of all CD45pos cells from Dataset 5 with the 13 genes characteristic of human NK cells as defined by Crinier et al. The error bars present the median +/- standard deviation. (n= 8 samples) c, Violin plot of the scoring with the 13 genes characteristic of human NK cells as defined by Crinier et al. The error bars present the median +/- standard deviation. (n= 13 samples) d, e, f, UMAP visualization of the expression of some key markers of NK1, NK2 and NK3 populations.

