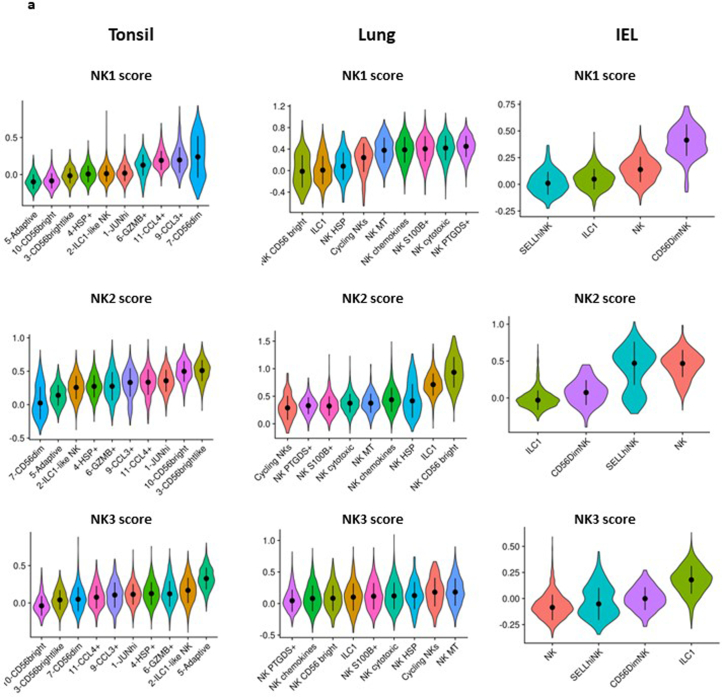
Extended Data Fig. 8. Distribution of NK1, NK2 and NK3 cell subsets in tissues.
Based on Dataset 7. a, ViolinPlot visualization of the module score of individual cells scored with signatures of NK1, NK2 and NK3 of ILC populations present in tonsil, lung and IELs and grouped by clusters (as defined in Dataset 7). The error bars present the median +/- standard deviation. (Lung: n = 4 samples, Tonsil: n = 6 samples, IEL: n = 4 samples).

