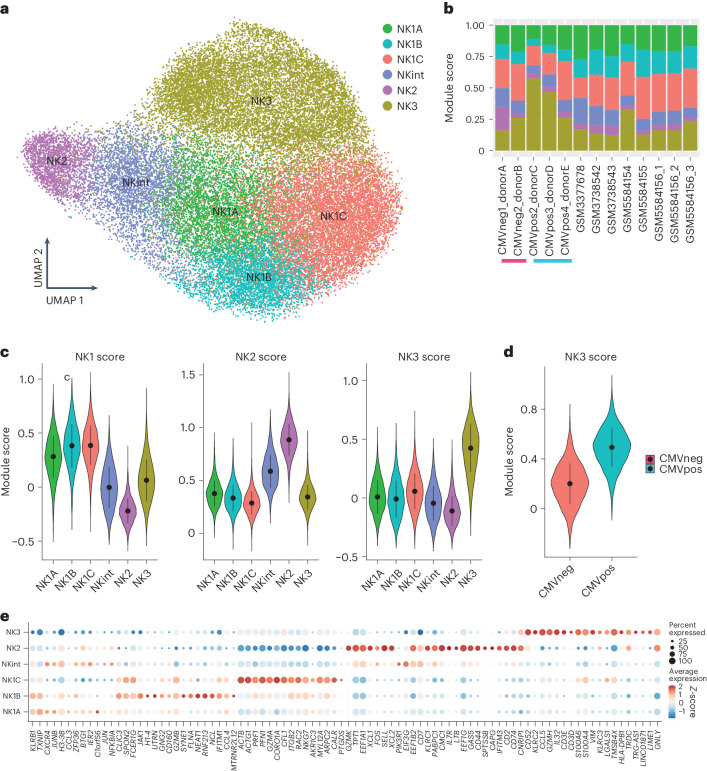
Fig. 2. The three most important NK cell populations can be subdivided into six subgroups.
Based on datasets 1–4a. a, UMAP visualization of NK cells sorted from healthy human blood, with clusters identified by unsupervised hierarchical clustering. b, Bar graph showing the proportion of cells within each cluster in all donors. Blue and pink bars are shown under HCMV-positive and HCMV-negative individuals, respectively. c, Violin plot of the scoring of the six NK clusters with respect to established NK1, NK2 and NK3 signatures (n = 13 samples). In the violin plots, the point is the median value. The error bars present the median +/- standard deviation. d, Violin plot of the scoring of the NK3 clusters with the NK3 signature in HCMV-positive and HCMV-negative individuals (n = 13 samples). e, Dot plot of the 20 most distinguishing genes for each subset of NK cells. Gene expression was analyzed using the two-sided Wilcoxon rank-sum test with Bonferroni adjustment. Ribosomal genes and mitochondrial genes were removed for clarity. The color indicates the Z-score scaled gene expression levels.

