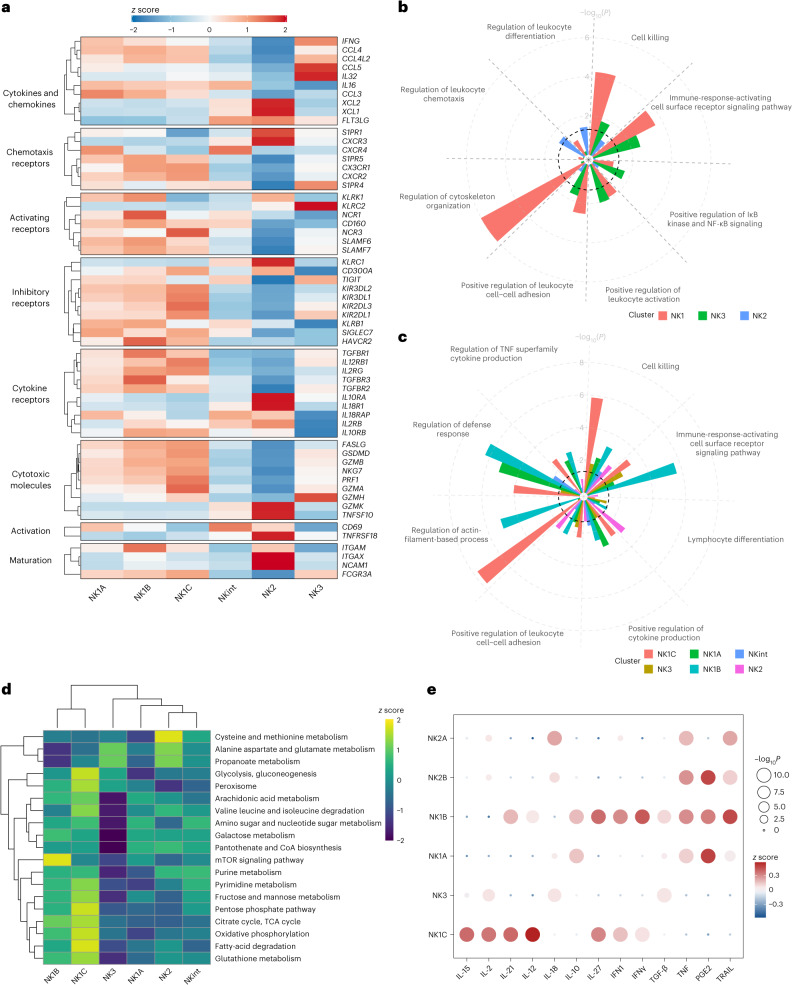
Fig. 3. Markers of interest, functions and metabolism characterizing NK cell populations.
Based on datasets 1–4a. a, Heatmap showing the differential expression of markers of interest among NK cell subsets. The color scale is based on z-score-scaled gene expression. The z-score distribution ranges from −2 (blue) to 2 (red). b,c, Selected GO terms showing enrichment in the three major populations (and six major subsets) of healthy human blood NK cells. Benjamini–Hochberg-corrected −log10(P) values were calculated by a hypergeometric test. The black dotted line indicates the significance threshold, which is −log10(0.05). d, Heatmap showing the differential enrichment for selected metabolic pathways among NK cell subsets. The color scale is based on the z score of the normalized enrichment score for each metabolic pathway. e, Assessment (z scores) of the response to different cytokines and chemokines in each subgroup, quantified by Cytosig. IFN, interferon; PGE2, prostaglandin E2. P values were computed by comparing z scores in one NK subset with those in other subsets using two-sided Student’s t-tests, and –log10(P) values exceeding 10 were capped at 10 to facilitate visualization.

