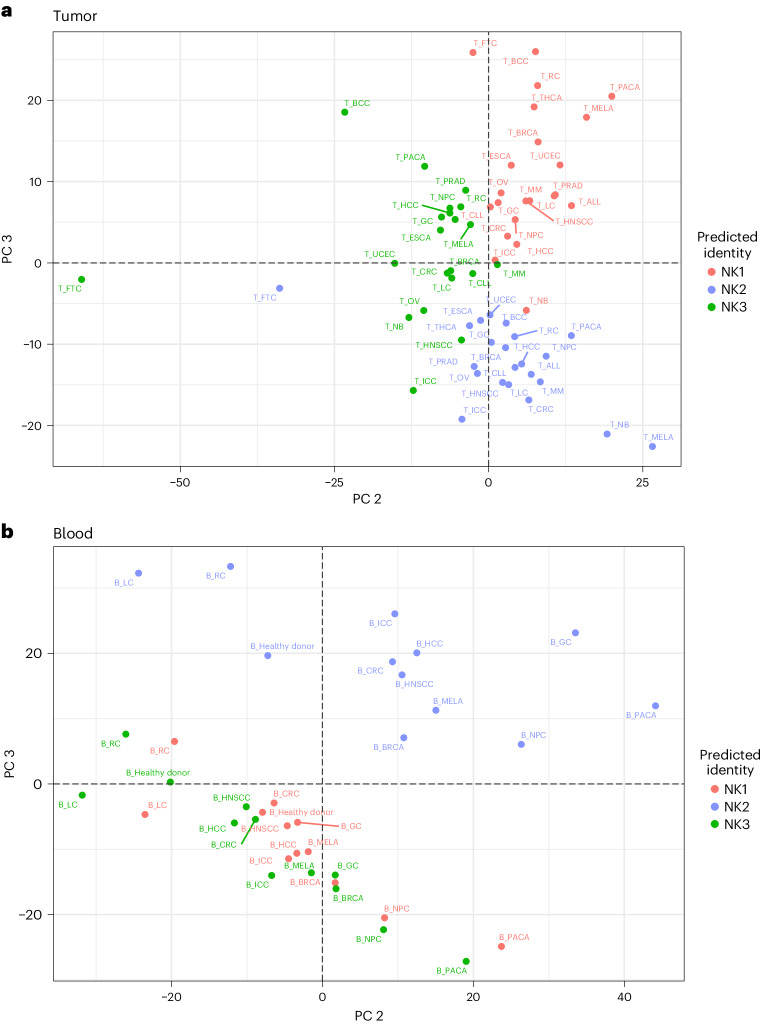
Fig. 8. Distinct transcriptional phenotypes of NK1, NK2 and NK3 cell subsets in the blood of people with cancer and at the tumor bed.
Based on datasets 1–4a and 6. a, PCA of blood NK cells, grouped by NK population and cancer conditions. The PCA is based on the mean expression levels of the 2,000 genes most differentially expressed across tissue and conditions. Groups are colored on the basis of NK cell subsets. PC2 and PC3 explained 8.1% and 7% of the variance, respectively (n = 676 samples). b, PCA of tumor-infiltrating NK cells, grouped by NK population and cancer conditions. The PCA is based on the mean expression levels of the 2,000 genes most differentially expressed across tissues and conditions. Groups are colored on the basis of NK cell subsets. PC2 and PC3 explained 13.9% and 12.7% of the variance, respectively (n = 676 samples).

