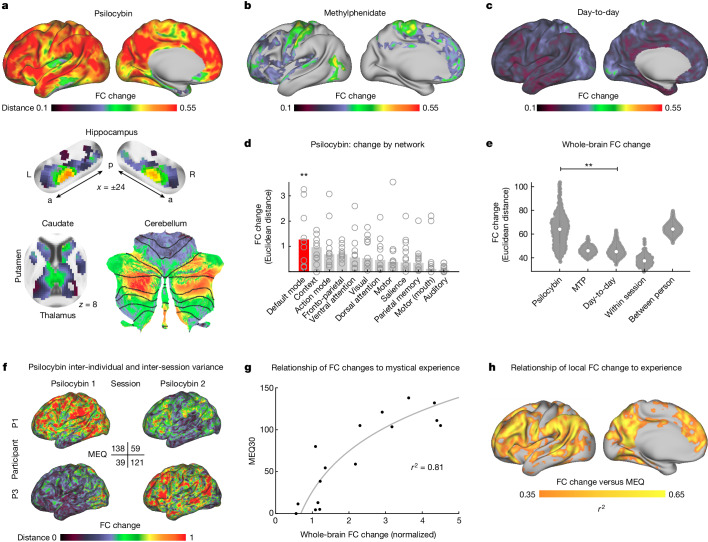
Fig. 1. Acute psilocybin effects on functional brain organization.
FC change (Euclidean distance) was calculated across the cortex and subcortical structures. Effects of drug condition were tested with an LME model in n = 6 longitudinally sampled participants over ten sessions with psilocybin and six sessions with methylphenidate (MTP) (a and b are thresholded at P < 0.05 based on permutation testing with TFCE; see unthresholded statistical maps in Extended Data Fig. 2). a, Psilocybin-associated FC change, including in subcortex. a, anterior; p, posterior; L, left; R, right. b, MTP-associated FC change. c, Typical day-to-day variability as a control to the drug conditions (unthresholded: not included in LME model). d, Average FC change in individual-defined networks. Open circles represent individual participants. FC change is larger in DMN than other networks. Rotation-based null model (spin test62,97): ten psilocybin doses, 1,000 permutations, one-sided Pspin < 0.001, (Pspin > 0.05 for all other networks). **P < 0.001, uncorrected. e, Whole-brain FC change (Euclidean distance from baseline) for all rest scans across conditions. FC change for MTP, psilocybin and day-to-day are in comparison to same-participant baseline. White dots indicate median, vertical lines indicate quartiles. LME model predicting whole-brain FC change: ten psilocybin doses (275 observations), estimate (95% CI) = 15.83 (13.50, 18.15), t(266) = 13.39, P = 1.36 × 10⁻³¹, uncorrected. For the full FC distance matrix with session labels, see Extended Data Fig. 3. f,g, Comparison of the differences in FC change to differences in psychedelic experiences. f, Individual FC change maps and MEQ30 scores for two exemplars (see Extended Data Fig. 4 for all drug sessions). g, The relationship between whole-brain FC change and mystical experience rating is plotted for all drug sessions (psilocybin and MTP). The LME model demonstrated a significant relationship: 16 drug doses (ten psilocybin, six MTP), estimate (95% CI) = 69.78 (50.15, 89.41), t(13) = 7.68, P = 3.5 × 10⁻⁶, uncorrected. h, The relationship between FC change and MEQ30 (r2) is mapped across the cortical surface.

