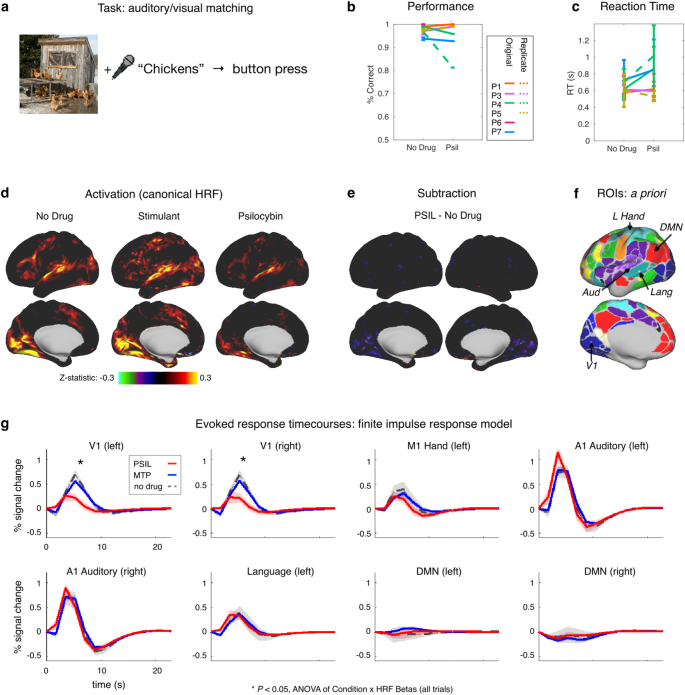
Extended Data Fig. 8. Auditory-visual matching fMRI task.
a) Schematic of auditory/visual matching task design. b) Comparison of performance (‘No Drug’ and psilocybin conditions are at ceiling). Lines indicate means and standard deviation across sessions. Number of task sessions are indicated in Supplementary Table 1. c) Comparison of reaction time (RT). Lines indicate mean and standard deviation across all trials (48 trials per session). d) Task fMRI activation maps (beta weights) and e) contrasts (simple subtraction) using the canonical hemodynamic response function (HRF). f) Eight a priori regions of interest for timecourse analyses. g) Average timecourses from the regions of interest shown in panel f, calculated using finite impulse response model over 13 TR x 1.761 s/TR = 22.89 seconds, for all trials. Shaded area around each line indicates SEM. ANOVAN of Condition x HRF Beta (Main effect of all trials) magnitude testing effect of drug, two-sided: Left V1, F(2,40) = 3.91, P = 0.030; Right V1, F(2,40) = 4.40, P = 0.020; Left M1 hand, F(2,40) = 0.40, P = 0.68; Left Auditory A1, F(2,40) = 0.22, P = 0.81; Right Auditory A1, F(2,40) = 0.77, P = 0.47; Left Language, F(2,40) = 0.025, P = 0.98; Left DMN, F(2,40) = 1.15, P = 0.33; Right DMN, F(2,40) = 0.14, P = 0.87. *P < 0.05. P-values are uncorrected for multiple comparisons.

