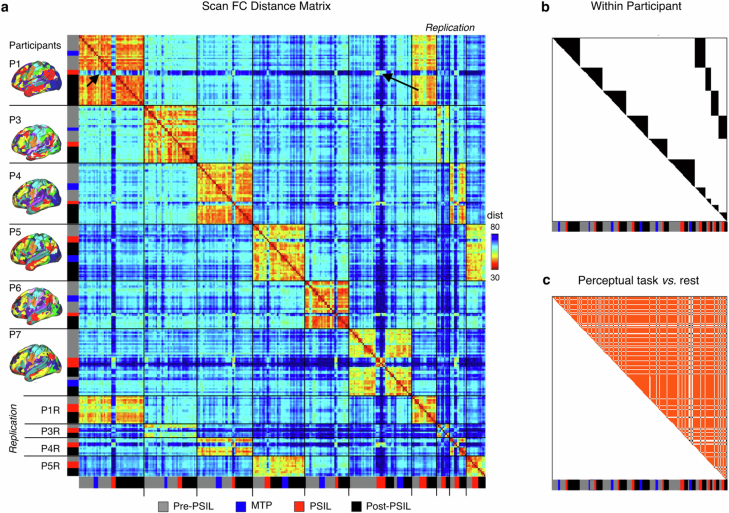
Extended Data Fig. 3. Functional connectivity (FC) distance and condition matrices for all fMRI scans.
Following Gratton et al.38, we compared FC matrices between rs-fMRI sessions to quantify contributors to variability in whole-brain FC. Under this approach, the effects of group, individual, session, and drug (as well as their interactions) are examined by first calculating the Euclidean distance among every pair of FC matrices (i.e., distance among the linearized upper triangles). a) In the resulting second-order distance matrix, each row and column show whole-brain FC from a single study visit. The colours in the matrix indicate distance between functional networks for a pair of visits (i.e., Euclidean distance between the linearized upper triangles of two FC matrices). Panels b and c demonstrate how the distance matrix was subdivided to compare different conditions. b) Black triangles represent distinct individuals. Replication protocol visits are listed at the end. c) Task and rest scans are shown in white and orange, respectively. Note that psilocybin scans (black arrows pointing to P1 psilocybin scans in panel a are very dissimilar to no-drug scans from the same individual (left arrow; in a) but have heightened similarity to psilocybin scans from other individuals (right arrow in a).

