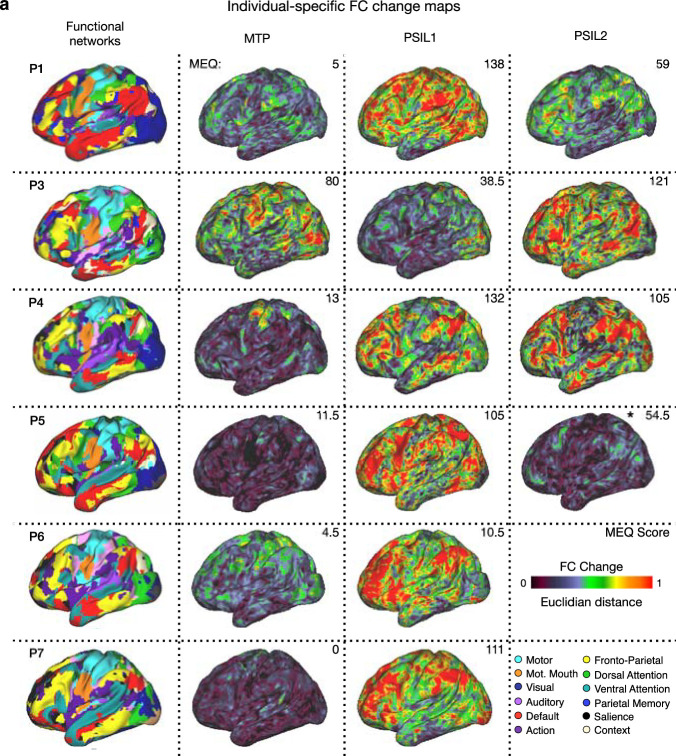
Extended Data Fig. 4. Participant-specific FC change maps for drug sessions.
Individual participant methylphenidate (MTP) and psilocybin (PSIL) FC change maps. Left most column shows individuals’ functional networks. Right 3 columns show FC change maps, generated by calculating Euclidean distance from baseline seedmaps for each vertex. For each session the total score on the Mystical Experience Questionnaire (MEQ30: out of a maximum of 150) is given in the upper right corner. *P5 had an episode of emesis 30 minutes after drug ingestion during PSIL2.

