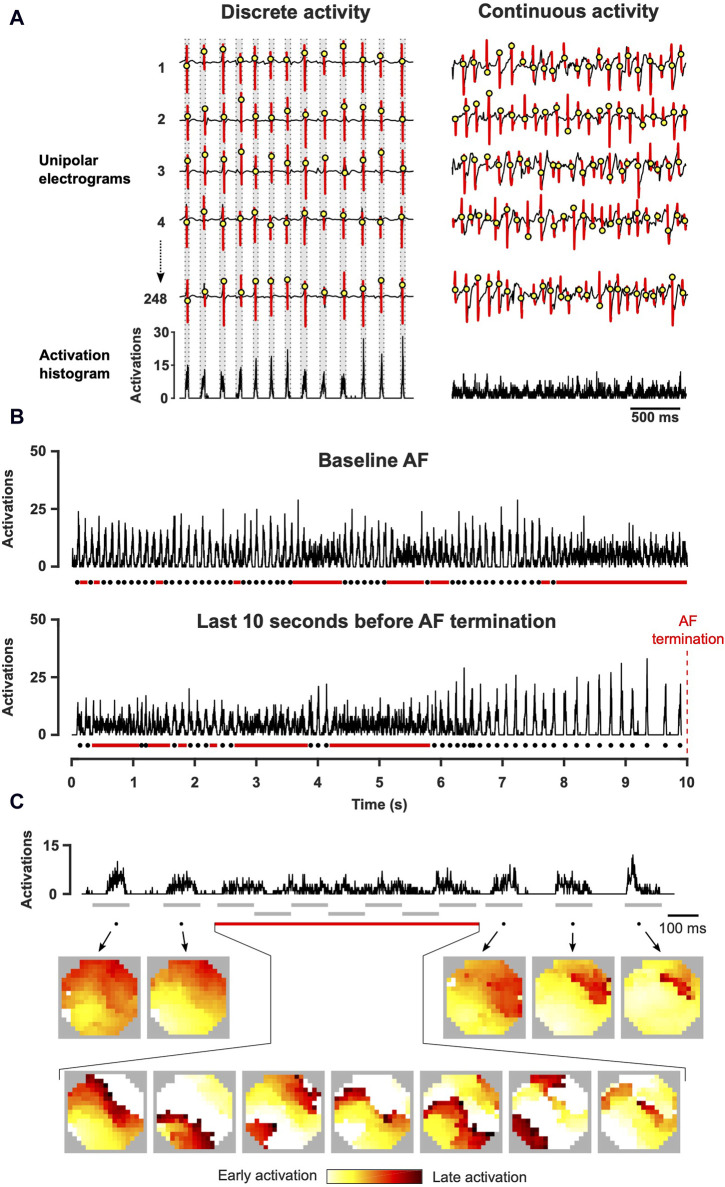
FIGURE 2.
Assessment of spatiotemporal organization with the construction of activation time histograms. (A) Local atrial activations were determined from unipolar electrograms. Activation time histogram represents the summation of these time points for all channels in the electrode array. (B) Representative examples of activation time histograms acquired at baseline AF and before AF termination (right atrium, XAF-1407 group). Dots indicate cycles of discrete activity and lines continuous activity. (C) Activation time histogram and the corresponding conduction patterns (left atrium, AP14145 group). During discrete activity, one or a few fibrillatory wave fronts activated the mapped area but multiple waves were continuously present during continuous activity. The grey lines indicate the intervals depicted in the activation maps.

