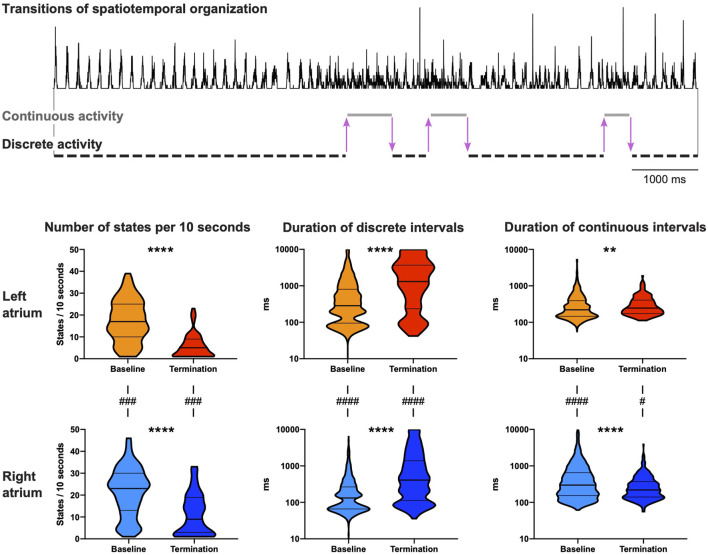
FIGURE 4.
Dynamic properties of spatiotemporal organization. Both continuous and discrete activities were observed at baseline and at 10 s before AF termination. The activation time histogram in the top panel presents an example (PA-6-induced termination) with six transitions in spatiotemporal organization before AF termination in the right atrium (3 transitions from discrete to continuous activity and 3 transitions from continuous to discrete activity, illustrated by purple arrows). Bottom panel shows the number of states (continuous and discrete activity) per 10 s and the duration of continuous and discrete intervals for both atria. Statistical analysis of the differences between baseline and AF termination was performed with a Mann-Whitney U test (**p < 0.01, ****p < 0.0001). The comparisons of the number of states between the left and the right atrium were performed with a Wilcoxon test, and for the duration of continuous and discrete intervals with a Mann-Whitney U test (# p < 0.05, ### p < 0.001, #### p < 0.0001). 65 AAD-induced AF terminations in 27 animals were included.

