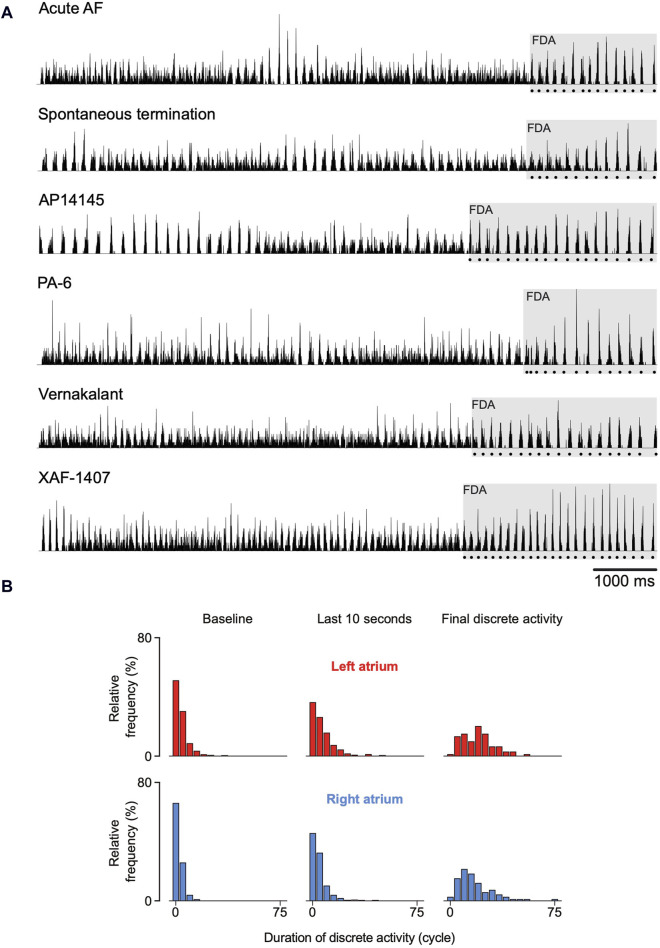
FIGURE 5.
Spatiotemporal organization just before termination of atrial fibrillation (AF). (A) Six randomly chosen normalized activation time histograms from the six investigated groups. The dotted line below the histograms delineates the final episode of discrete activity (FDA). (B) In general, FDAs lasted more AF cycles than other discrete periods. An FDA could only be detected if at least one transition from continuous to discrete activity occurred during the last 10 s before AF termination. As a consequence, not all terminations could be included and the number of FDAs differed between atria. 64 FDAs were observed in the right atrium and 58 in the left atrium.

