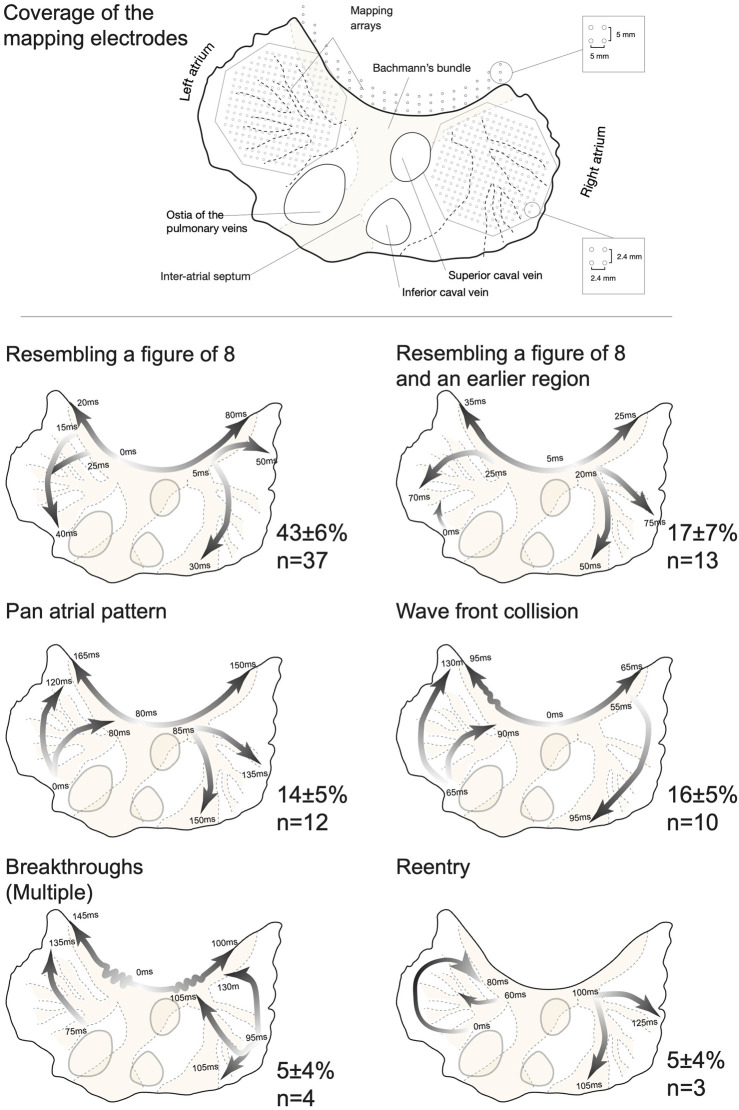
FIGURE 7.
Conduction patterns immediately preceding termination of atrial fibrillation (AF). Top: A topographical outline of the goat atria was created using a specimen that was mounted and transilluminated to visualize the atrial anatomy. Large structures such as the interatrial septum, Bachmann’s bundle and larger bundles are shown by a shade of orange to present the orientation of the mapping electrodes. The Bachmann’s bundle mapping electrode was only present in the vernakalant group. Bottom: Examples of the six different types of AF termination patterns. Global wave fronts are presented by arrows, with white shade indicating the start and the dark shade representing the last activated area. The start and end times of the wave fronts are given in milliseconds with the earliest time point being 0 ms. The incidence (in percentage) of patterns per group was determined and averaged (±SEM) for the whole dataset. Table 3 presents a detailed report on the number of observations per group and pattern type.

