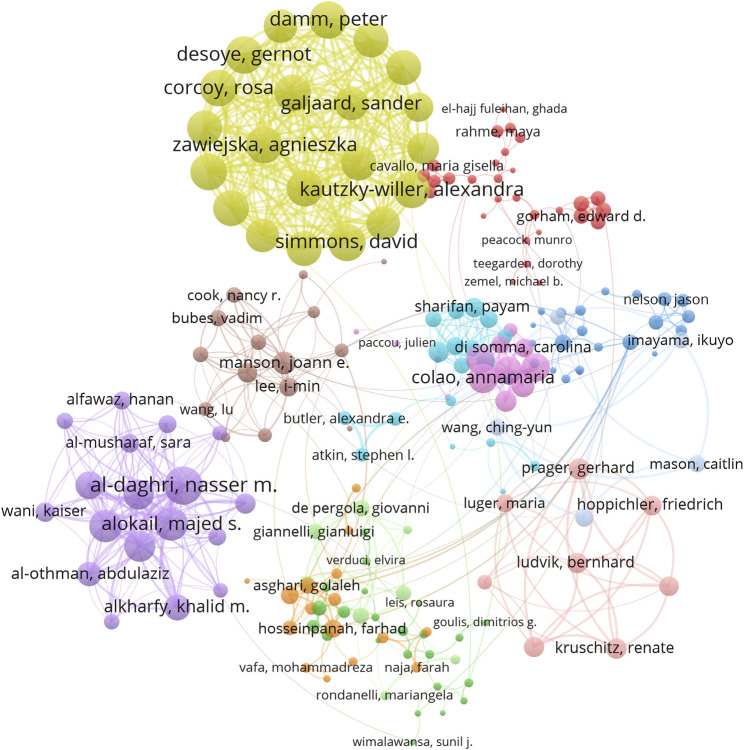
FIGURE 5.
Analysis of active author. Each author represents a node, the size of the node is proportional to the strength of the collaboration link, each line represents a co-authoring relationship, and the line thickness indicates the strength of the collaboration link. The color of a node represents the cluster it belongs to.

