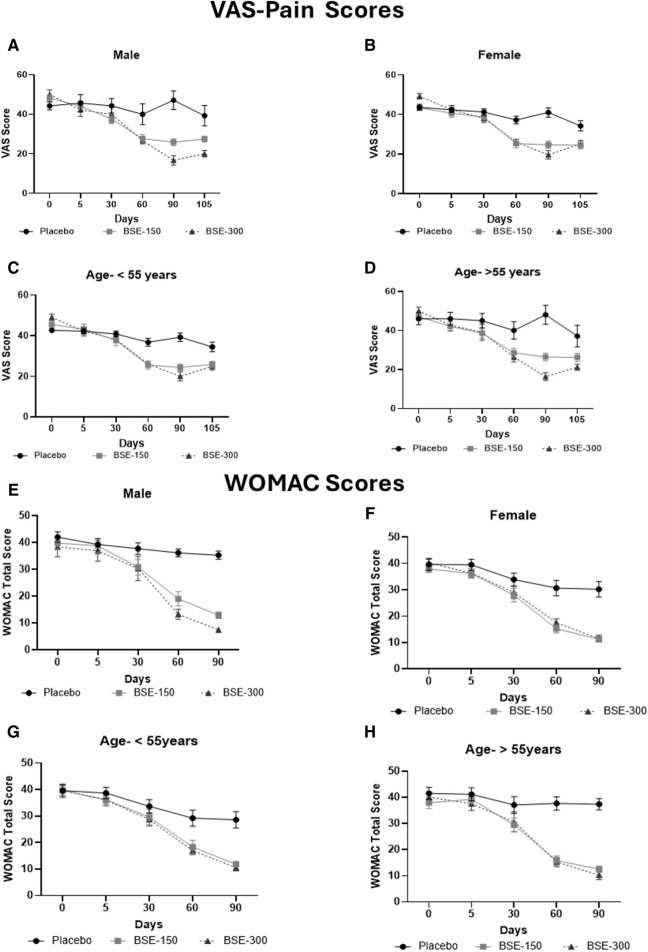
FIGURE 3.
VAS and WOMAC total scores in age and gender specific groups: Visual analog scale for pain (VAS) in (A): Male, (B): Female, (C): Age <55 years, (D): > 55 years, Western Ontario McMaster Index (WOMAC) total scores in (E): Male, (F): Female, (G): Age < 55 years, (H): > 55 years in a gender and age specific analysis, in placebo, BSE-150 and BSE-300 groups. Each point represents Mean ± SEM. Study participants were grouped into two age groups <55 years (40–55 years) and >55 years (56–70 years). The parameters are analyzed in male and female participants and in the two age groups.

