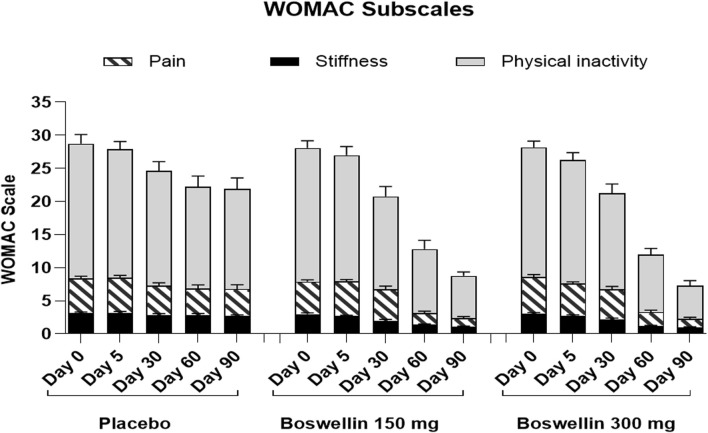
FIGURE 4.
WOMAC pain, stiffness and difficulty in physical activity scores WOMAC pain, stiffness and difficulty in physical activity scores of placebo, BSE-150 and BSE-300 groups at different time points day 0, day 30, day 60 and day 90. Each bar represents Mean ± SEM. In comparison with Day 0, the mean scores in the treatment groups were tested for significance using Dunnett’s multiple comparisons test. The decrease in WOMAC pain and physical activity scores were significant (p < 0.05) on days 60 and 90 in comparison to day 0 in placebo, and from day 30 to 90 compared to day 0 (p < 0.001) in BSE-150 and BSE-300 compared to day 0. The stiffness improvement was significant only in BSE-150 and BSE-300 from day 30 onwards. The sub scores showed significant (p < 0.05) in BSE-300 on day 5 compared to day 0.

