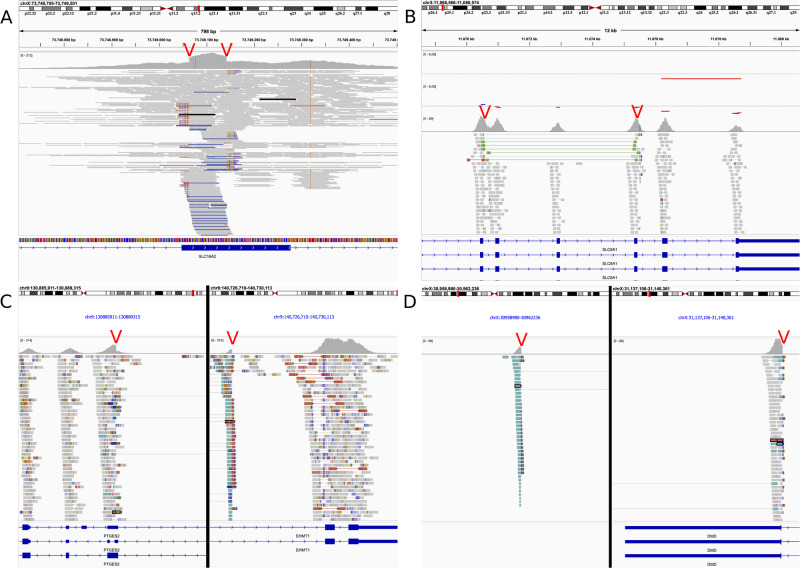
Fig. 1. Visualisation of read aligments for various types of pathogenic SVs in the tool IGV.
A Simple duplication of 70 base pairs missed by RD-based CNV analysis and short variant calling. B A complex SV: paired-end distance indicates the presence of a tandem duplication. RD-based CNV calling (top 2 tracks) indicates the presence of a deletion next to the detected duplication, together forming a complex SV. C A 9.8Mb- long genomic inversion affecting the penultimate intron in EHMT1 was detected via structural variant calling. D 179Kb long inversion involving the last exon of the DMD gene. Screenshots produced using Integrative Genomics Viewer [21]. Red arrows indicate the breakpoints identified via SV analysis.

