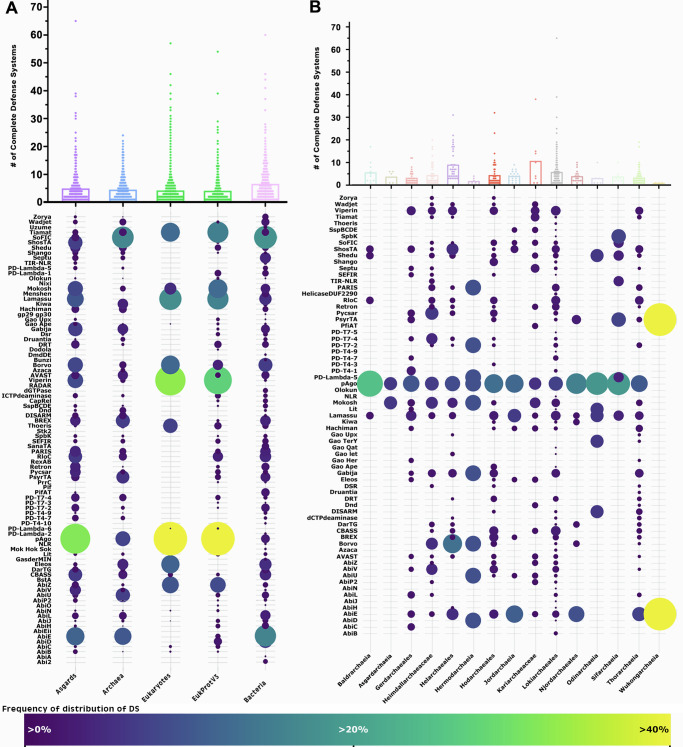
Fig. 1. Distribution of defense systems across the tree of life and in Asgard archaea.
A The total number of complete defense systems (DS) in each genomic dataset used in this study. The bubble plot shows the frequency of distribution of DS identified (Y-axis) in the datasets (X-axis). B The total number of DS across Asgardarchaeota genomes. Bubble plot: frequency of distribution of DS in each Asgardarchaeota group. Dots in the graphs represent the number of DS in a single genome from the respective group. The size and the color of the dots in the bubble plot are proportional to the prevalence of the DS in that group. For clarity, the 2 most prevalent DS (CRISPR and RM) across the genomic datasets were removed from both bubble plots representation. DS less found in Eukaryotes (check Methods section for the list) were also removed from the bubble plot in panel A.

