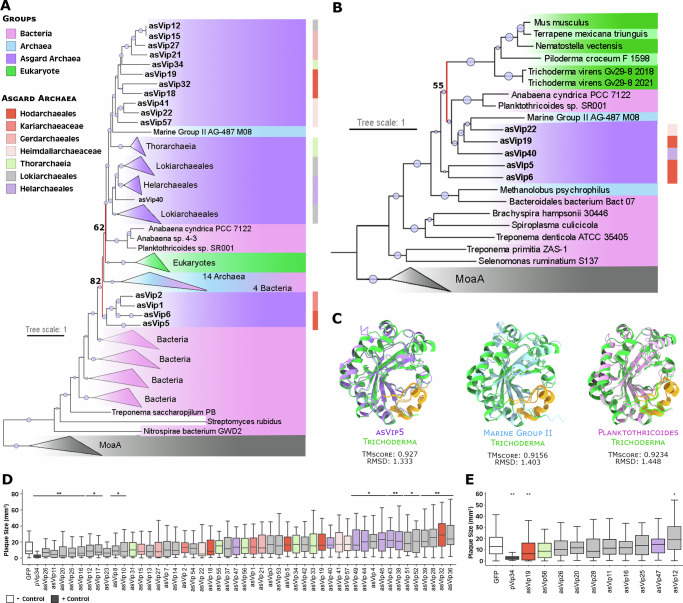
Fig. 2. Evolutionary history and anti-phage activity of Asgard viperins.
A Phylogenetic analysis of viperins. Viperins phylogeny revealed ancestral links of eVip (eukaryotic viperin) with asVip (asgard viperin) (nodes marked in red), particularly those within the Heimdallarchaeia class (including Kariarchaeaceae (2), Heimdallarchaeaceae (3) and Hodarchaeales (5)). The size of the dots on the nodes is proportional to bootstrap values ranging between 60 and 100. B Structure-based homology of viperins. Consistent with the sequence homology-based phylogenetic tree, the eVip structure appears to have been inherited from asVip (red node). The darker green color represents reference sequences predicted experimentally. The size of the dots at the center of the nodes is proportional to bootstrap values ranging between 50 and 100. C Superposition of an eVip structure, predicted by X-ray diffraction (green), and the structural models of an asVip, archaeal viperin (arVip), and bacterial viperin (from left to right). The yellow color in the models emphasizes the high conservation of the viperin catalytic site across the tree of life. The information regarding bacteria, archaea, asgard archaea and eukaryotes in panels (A–C) are represented by the pink, blue, purple and green color respectively. D Anti-T7 phage activity of asVip in E. coli. Nine asVip (asVip 26,11,20,25,16,12,17,23,8) exhibited anti-viral activity as indicated by the p-values (*p < 0.05; **p < 0.01). E Anti-T7 phage activity of asVip after codon optimization for their expression in E. coli. One asVip from a Hodarchaeales organism provided protection against viral infection (asVip 19). The center line of each box plot denotes the median; the box contains the 25th to 75th percentiles. Black whiskers mark the 5th and 95th percentiles. pVip34 is a prokaryotic viperin selected as a positive control from Bernheim et al.13. Each experimental condition includes, on average, 53 plaques pooled from three biological replicates. A two-tailed t-test was used to calculate statistical significance in figures (E, D).

