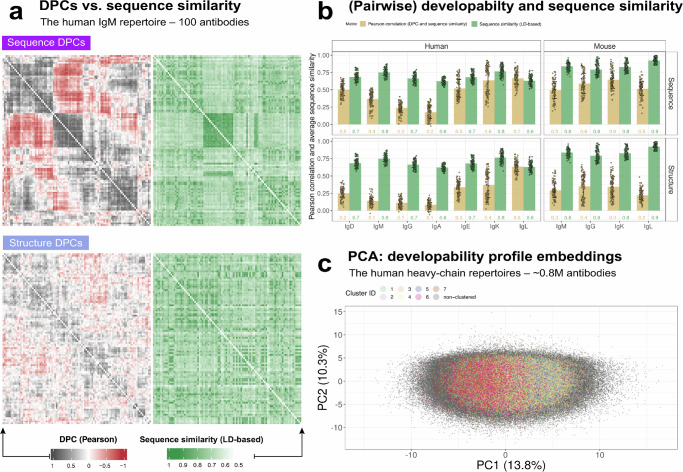
Fig. 5. Developability profile similarity is not necessarily associated with sequence similarity.
a Pairwise developability profile Pearson correlation (DPC—left panels) alongside the pairwise Levenshtein distance (LD) based-sequence similarity score (right panels—see Methods) for a random sample of n = 100 antibodies from the human IgM dataset (100 × 100 matrices) that share the same IGHV gene family (IGHV1) annotation (shown both for sequence and structure DPLs). Each row and each column represent a single antibody sequence. Rows and columns in the left panels were hierarchically clustered. In the right panels (sequence similarity), rows and columns were ordered in the same order as the corresponding left panel (DPC) for ease of comparison. The distribution of DPC and sequence similarity is shown in Supplementary Fig. 16A. b Pearson correlation between DPC and sequence similarity matrices for 100 sets of randomly sampled non-overlapping 100 antibody sequences (within the same IGHV gene family per batch) from all isotypes of the native dataset (total n = 100 independent experiments of 100 antibodies per experiment). Pearson correlation coefficient values (shown in beige) are presented alongside the corresponding mean sequence similarity values (shown in green) for the same 100 sets. The height of the bars and the numerical values on the figure reflect the mean of the corresponding metric (mean Pearson correlation and the mean sequence similarity). The error bars represent the standard deviation. c Principal component analysis (PCA) of the developability profiles of the native human heavy-chain dataset (n = ~0.8 M antibodies). The developability profiles (DPLs) were utilized as embeddings for this analysis (see Methods). Antibody clusters (1–7) were created for the groups of antibodies that are at least 75% similar in sequence (as determined by USEARCH) and contain at least 10 K antibodies. Antibodies that did not satisfy the clustering conditions were labeled as “non-clustered” (727861 sequences) and sent to the back layer of the figure. For antibody counts per cluster, please refer to Supplementary Fig. 16B. Supplementary Figs. 13–16.

