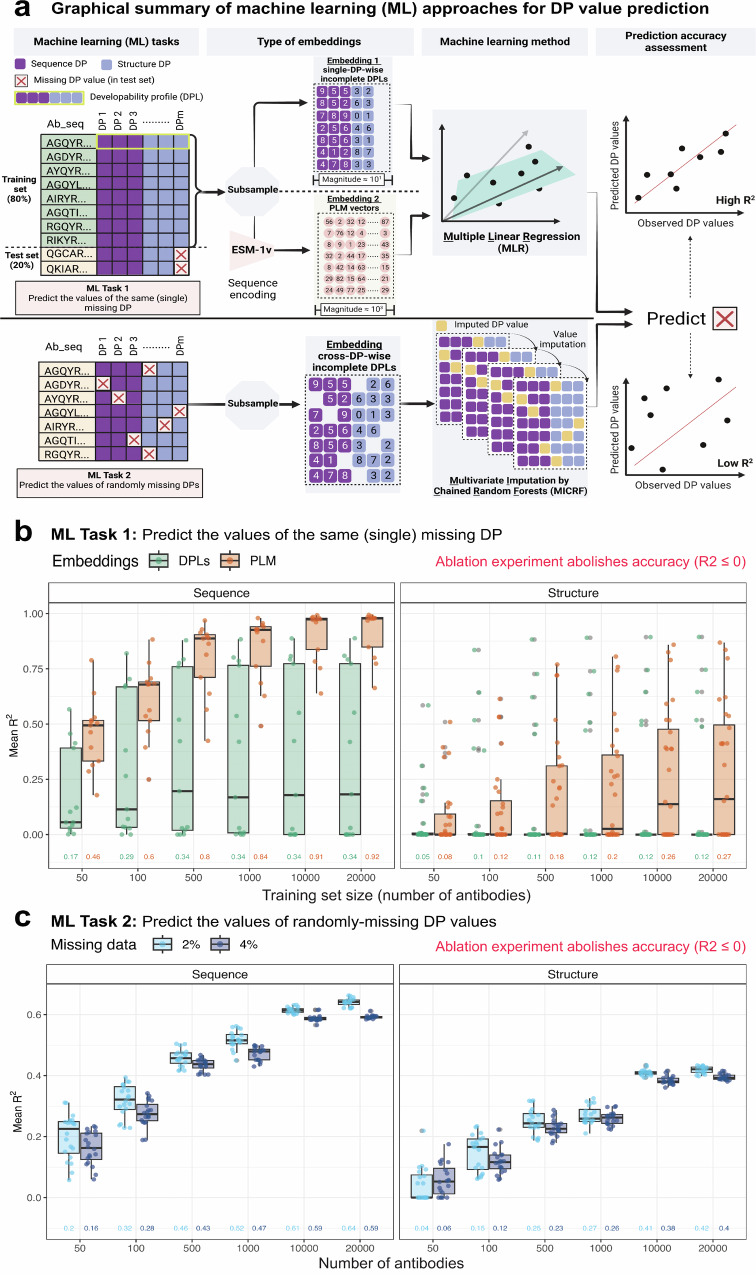
Fig. 6. Sequence-based developability parameters are more predictable than structure-based parameters.
a Graphical representation of machine learning (ML) approaches used to assess the predictability of DPs. We investigated two scenarios where the missing (deleted) DP values were either all from one (single) DP (ML Task 1) or were randomly missing from several DPs (ML Task 2). For ML Task 1, we compared the predictive accuracy of two different embeddings; single-DP-wise incomplete developability profiles (DPLs) (embedding 1; order of magnitude 101) and PLM vectors (embedding 2; order of magnitude 103). We used these embeddings to train multiple linear regression (MLR) models (separately) to predict the missing DP values in the test set. To enable the comparison between these two embeddings, we used identical training subsamples (in regards to size and antibody identity, see Methods). For ML Task 2, we used cross-DP-wise incomplete developability profiles as input for the multivariate imputation by chained random forests (MICRF) algorithm to predict missing DP values. For both ML tasks, we estimated the prediction accuracy by computing the coefficient of determination (R2) using observed and predicted DP values171. b Comparison of the predictive accuracy of incomplete developability profiles (single-DP-wise incomplete DPLs) and PLM vectors as embeddings for MLR models to predict the values of missing DPs in the test set (ML Task 1). The x-axis reflects the number of antibody sequences (sample size) used for the embedding. For each sample size, we repeated the prediction of missing DPs 20 times (n = 20 independent experiments). The y-axis represents the mean R2 for sequence DPs (left facet) and structure DPs (right facet). Error bars represent the standard deviation of R2. Missing DPs tested in this analysis belonged to the MWDS exclusively, as determined at a Pearson correlation coefficient threshold of 0.6, for the human IgG dataset, summing to 13 sequence DPs and 28 structure DPs (after removing a single element from each doublet and immunogenicity DPs, Supplementary Table 2). c Evaluating the predictability of randomly missing DP values using the MICRF algorithm where cross-DP-wise incomplete developability profiles are used as embeddings. The x-axis reflects the number of antibodies (sample size) used for the embedding. For each sample size, we repeated the prediction of missing DPs 20 times (n = 20 independent experiments). The y-axis represents the mean R2 for sequence DPs (left facet) and structure DPs (right facet) when the proportion of the missing data is either 2% (light blue line) or 4% (dark blue line). Missing DPs tested in this analysis belonged to the MWDS, analogously to (b). Numbers on the x-axis in both (b) and (c) reflect the average values of mean R2. Supplementary Fig. 17.

