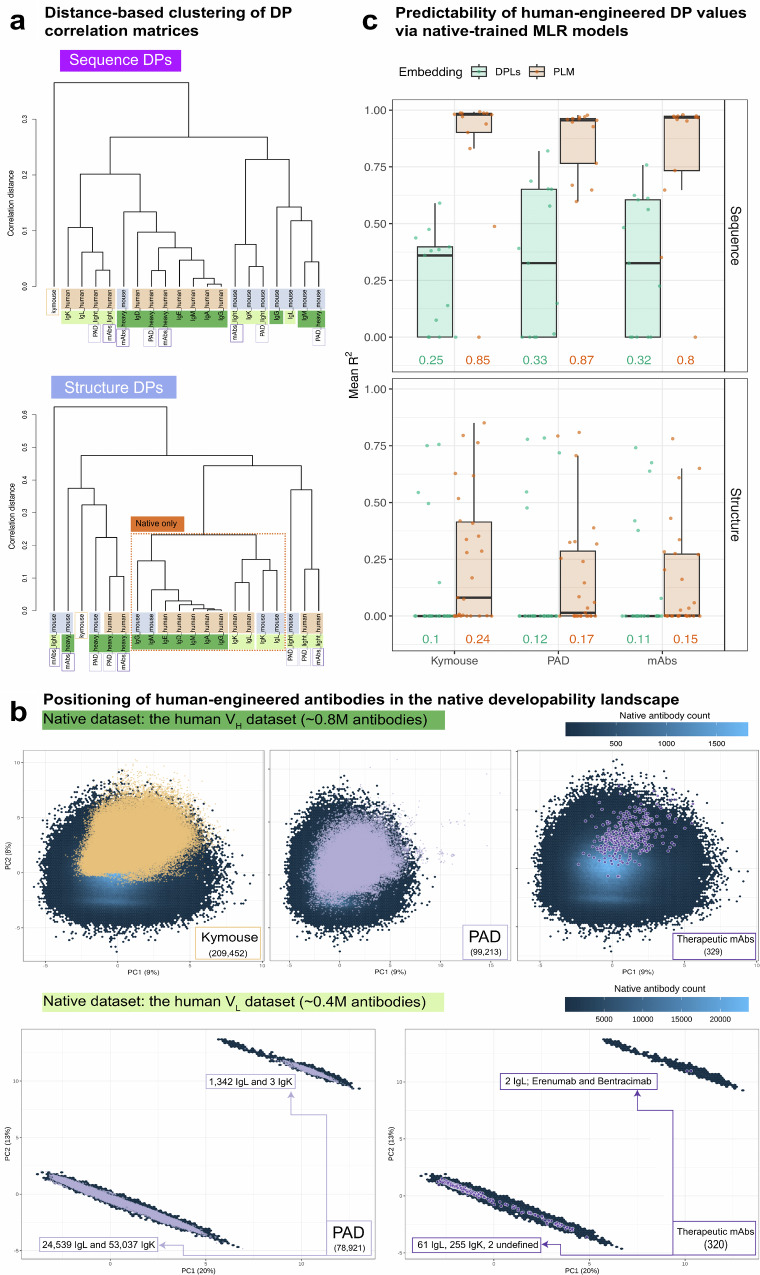
Fig. 7. Human-engineered antibodies are contained in the developability landscape of natural antibodies.
a Distance-based hierarchical clustering of isotype-specific pairwise DP correlation matrices (sequence and structure levels—similar to the analysis shown in Fig. 3a). The height of the dendrograms (shown to the left of the figure) represents the correlation distance among the dendrogram tips. The dashed square in the right (structure-based) panel highlights the native-only dataset. b Top three panels: The positioning of the human-aligned human-engineered VH antibodies (Kymouse; 209,452, PAD; 99,213 and therapeutic mAbs; 329) in the developability profile space of the native human VH dataset (854,418 antibodies) based on a principal component analysis (PCA, see Methods). Bottom two panels: The positioning of the human-aligned human-engineered VL antibodies (PAD; 78,921 and therapeutic mAbs; 320) in the developability space of the native human VL dataset (385,633 antibodies). The hexagonal bins (shown in the back layer) represent the count of native antibodies (scale shown on the top right of the panels), and the human-engineered antibodies are represented as data points. c Evaluating the predictability of sequence (left panel) and structure DPs of the human-aligned human-engineered VH antibodies (Kymouse; 209,452, PAD; 99,213 and therapeutic mAbs; 329), using multiple linear regression (MLR) models trained on native human VH antibodies. As explained in Fig. 6a (ML Task 1), the predictive accuracy of two types of embeddings was tested, including single-DP-wise incomplete developability profiles (DPLs) and ESM-1v protein language model encoding vectors (PLM). MLR models were trained using 1000 antibodies for DPL-based predictions and 20000 antibodies for PLM-based predictions (respective saturation points). Missing DPs tested in this analysis belonged to the MWDS exclusively as determined at a Pearson correlation coefficient threshold of 0.6, for the native human IgG dataset, summing to 13 sequence DPs and 28 structure DPs (Supplementary Table 2). The y-axis represents the mean coefficient of determination (R2) across 20 repetitions (n = 20 independent experiments). Numerical values shown represent the average values of mean R2 across (sequence or structure) DPs. Supplementary Figs. 18–21.

