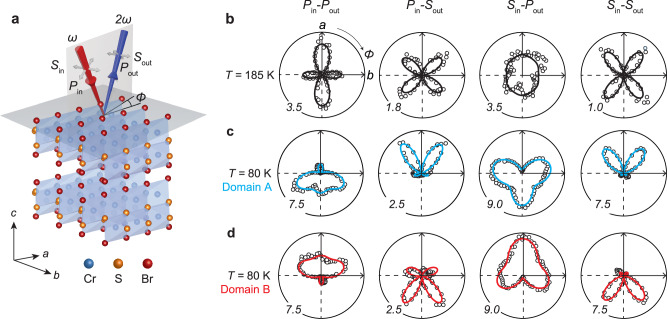
Fig. 3. SHG RA revealing two degenerate magnetic domain states.
a schematic of the oblique incidence SHG RA measurement taken on a bulk CrSBr crystal. Red arrow: incident fundamental light, blue arrow: outgoing SHG light, gray arrows: light polarizations, , frequency of the incident light. b–d SHG RA polar plots in four channels (P/Sin-P/Sout) at b 185 K, c 80 K from domain A and d 80 K from domain B. Experiment data (circles) are fitted by functional forms simulated based on group theory analysis (solid curves). Numbers at the corners indicate the scales of the polar plots, with 1.0 corresponding to 1 fW.

