
Fig. 5. Temperature-dependent SHG RA revealing the surface and the extraordinary phase transitions.
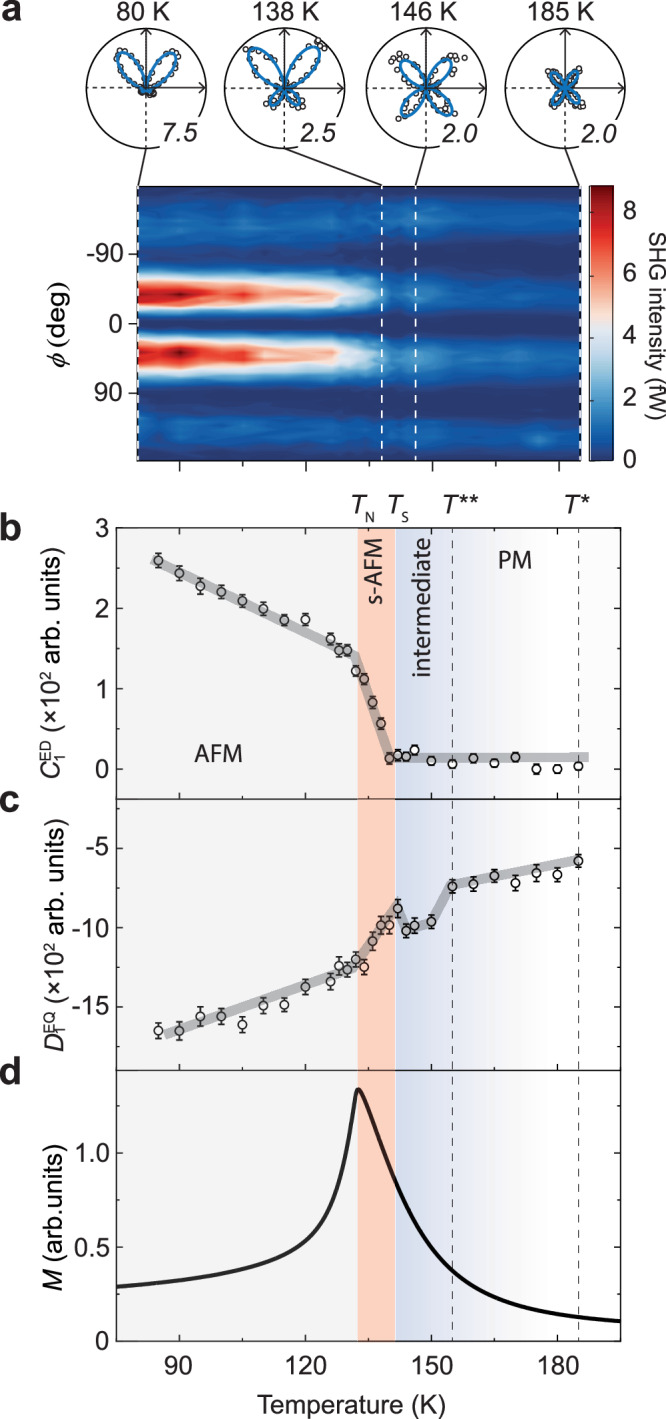
a lower: contour plot of the SHG RA in the Sin-Sout channel as a function of temperature. Upper: SHG RA polar plots in the Sin-Sout channel at four selected temperatures. b The electric dipole (ED) coefficient and (c) the electric quadrupole (EQ) coefficient as a function of temperature. Gray curves serve as guides to the eyes. The temperature dependent SHG data were collected during the warming up cycle. d magnetization as a function of temperature measured under 1000 Oe magnetic field along the b-axis. The regions of paramagnetism (PM), intermediate magnetic crossover (intermediate), surface antiferromagnetism (s-AFM) and bulk antiferromagnetism (AFM) are shaded in different colors, with their characteristic temperatures marked. Error bars indicate the standard deviation from the fitting.