
FIGURE 4.
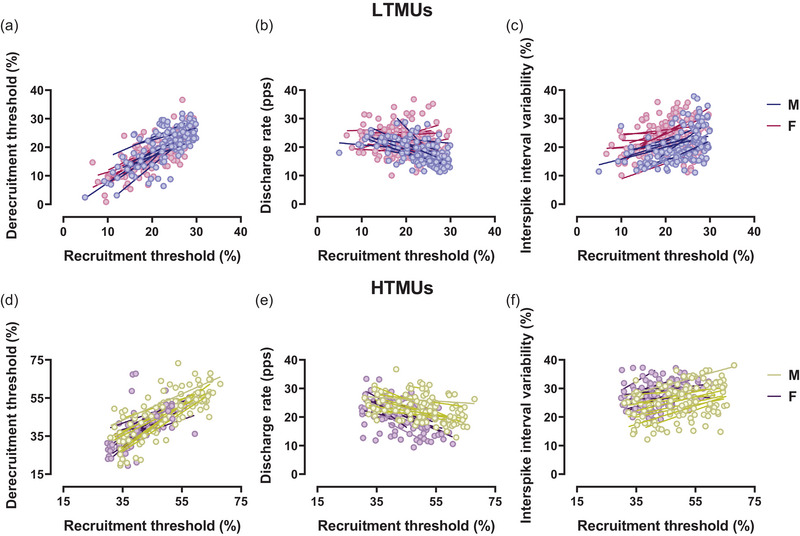
Sex‐related differences in DT, DR and ISIv as a function of the recruitment threshold. (a–c) Scatter plots of lower‐threshold motor unit results for DT–RT (a), DR–RT (b) and ISIv–RT (c). (d–f) Higher‐threshold motor unit results for DT–RT (d), DR–RT (e) and ISIv–RT (f). Each circle represents an identified motor unit. Single slopes per participant are reported for both male and female participants. DT, derecruitment threshold; ISIv, interspike interval variability; RT, recruitment threshold.