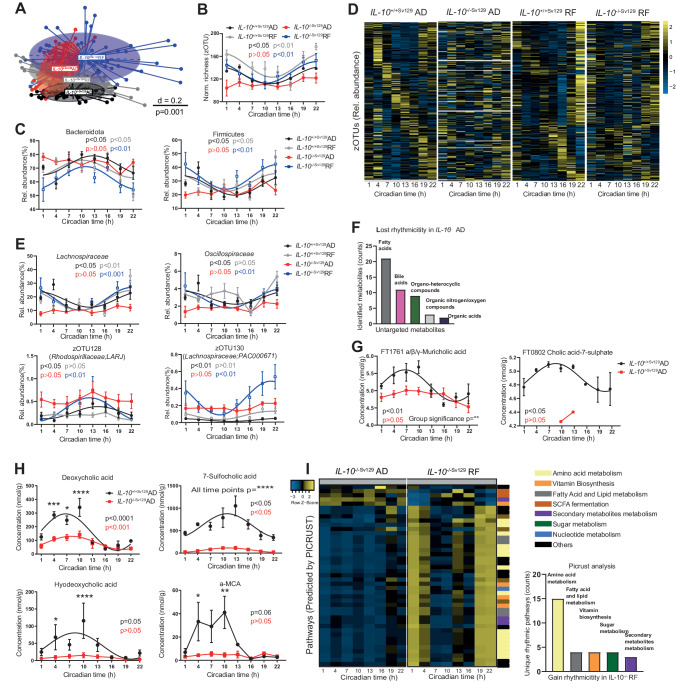
Fig. 2.
Impaired microbiome rhythms in IL-10−/−SV129 mice are restored after RF. A Beta-diversity illustrated by MDS plots of fecal microbiota based on generalized UniFrac distances (GUniFrac) in wild type and IL-10−/−Sv129 mice under AD and RF conditions. Comparison of genotype and feeding effects was performed by PERMANOVA (adj.p = 0.001). Data points represent individual sample collected from different mice at different time points (n > 5 mice/time points for each group). B Circadian profile of normalized richness and C relative abundance of phyla in wild type and IL-10−/−Sv129 mice under AD and RF conditions. D Heatmap depicting the relative abundance of zOTUs (mean relative abundance>0.1%; prevalence > 10%). Data from IL-10−/−Sv129 mice under AD or RF conditions are normalized to the peak of each zOTU and ordered by the peak phase in wild type mice under AD or RF conditions, respectively. Yellow and blue indicate high and low abundance, respectively. Each column represents the group average for each time point. E Relative abundance of highly abundant families and representative zOTUs from wild type and IL-10−/−Sv129 mice under AD and RF conditions. F Classification of the top 5 fully annotated super classes of metabolites that lost rhythmicity in IL-10−/−Sv129 mice under AD. Circadian profiles of bile acids (BAs) G measured by untargeted or H targeted metabolomics of wild type and IL-10−/−Sv129 mice under AD conditions. At some time points (CT 1, 4, 7, 16, 19, and 22) the levels for the IL-10−/− group were under the detection limit and thus not illustrated in the graph. I Heatmap of pathways (calculated by PICRUST 2.0) with restored rhythms in IL-10−/−Sv129 mice under RF (left) and the quantification of the superclass (right). Rhythmicity identified by JTK_Cycle (Bonferroni adj. p value ≤ 0.05). Significant rhythms are illustrated with fitted cosine-regression; data points connected by straight lines indicate no significant cosine fit curves (p > 0.05) and thus no rhythmicity. Comparisons of groups were performed by two-way ANOVA followed by Sidak correction. The results are summarized in Supplementary Table 3. Data are represented as the mean ± SEM. Details on mouse numbers per time point are summarized in Supplementary Table 6

