Fig. 3.
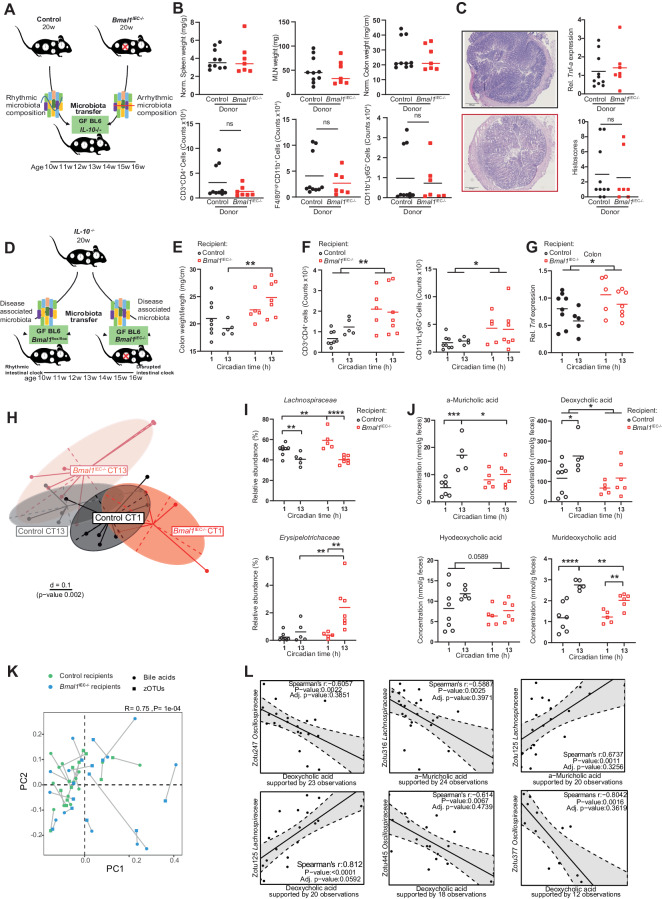
Dysfunction of the host intestinal clock promotes microbiota-induced colonic inflammation. A Schematic illustration of the experimental design. Cecal contents from control (rhythmic) and Bmal1IEC−/− (arrhythmic) donors were transferred to germ-free IL-10−/−BL6 mice. B Organ weights (top) and number of immune cells recruited into the colonic LP (bottom) of the recipients. C Representative H&E staining of colonic cross sections from the recipients (left) and Tnf gene expression, as well as histopathological scores (right). D Schematic illustration of the experimental design. Disease-associated microbiota from IL-10−/− donors was transferred to germ-free control (Bmal1flox/flox) and Bmal1IEC−/− recipients. E Colon weight, F number of immune cells recruited into the colonic lamina propria and G Tnf expression in colon tissues from recipients. H Beta diversity illustrated by MDS plots of cecal microbiota based on generalized UniFrac distances (GUniFrac) in recipients at circadian times (CTs) 1 and 13. I Relative abundance of families and J amounts of α-muricholic acid (α-MCA), deoxycholic acid (DCA), hyodeoxycholic acid (HDCA) and murideoxycholic acid (MDCA) in the cecal contents of control and Bmal1IEC−/− recipients. K Procrustes analysis (PA) of the cecal microbiota and bile acid (BA) levels. The length of the line is proportional to the divergence between the data from the same mouse. L Representative correlation plot between zOTUs and BAs. The data points represent individual mice (n > 5/time points for each genotype). Mann–Whitney U tests and two-way ANOVA followed by Benjamini–Hochberg correction were used. Asterisks indicate significant differences; *p < 0.05, **p < 0.01, ****p < 0.0001. The data are presented as the mean ± SEMs. Details on the number of mice per time point are summarized in Supplementary Table 6

