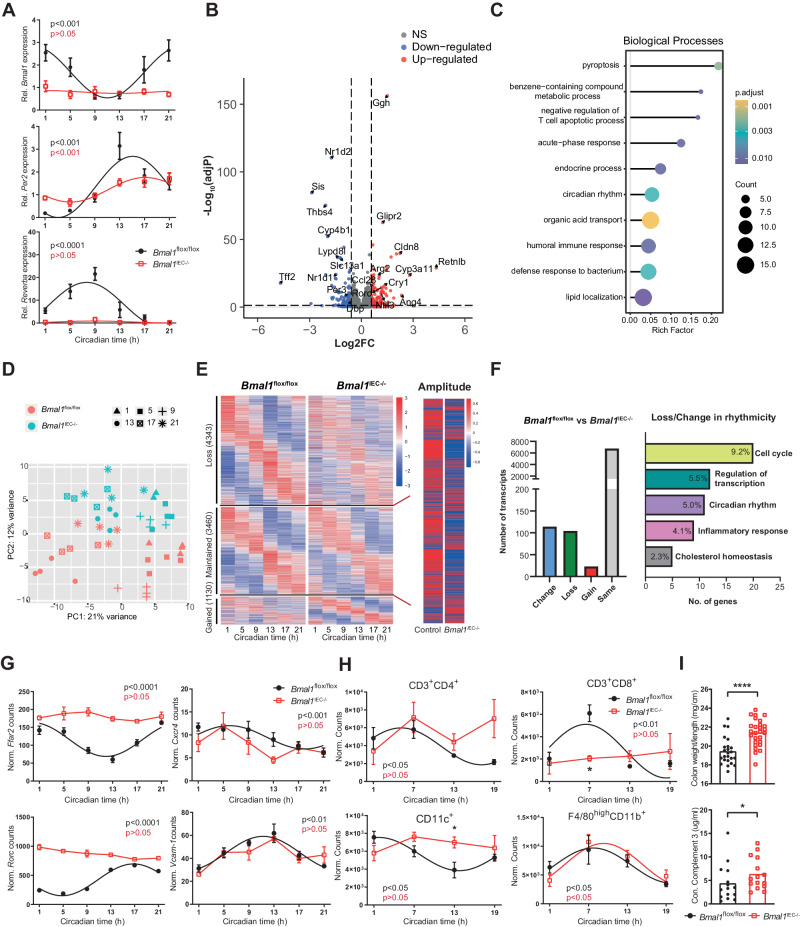
Fig. 4.
The intestinal clock regulates transcripts involved in intestinal immune responses. A Clock gene expression and B volcano plot of transcriptional changes (upregulated: adjusted p < 0.05, FC > 1.5, red; downregulated: adjusted p < 0.05, FC > 1.5, blue) in colon tissues from control and Bmal1IEC−/− mice. C Gene Ontology enrichment analysis of differentially expressed genes. D Principal component analysis of 46 colon samples obtained from control (red) and Bmal1IEC−/− (blue) mice. Different shapes indicate different circadian time (CT) points. E Heatmap of transcripts that lost, maintained or gained rhythmicity in colon tissues from Bmal1IEC−/− mice (left) and amplitude comparison of the transcripts that maintained rhythmicity (right) (JTK_cycle adj.p < 0.05 as rhythmic). Transcripts are ordered according to the peak phase of the control groups. Each column represents the group average for each time point. F Number of transcripts whose rhythmic changes were lost/changed according to comparison (left) and GO analysis (top 5, right). Circadian profiles of G gene expression and immune cell frequency H in the colonic LP of control and Bmal1IEC−/− mice. I Colon weight (top) and complement 3 levels in the feces of control and Bmal1IEC−/− mice. The data points represent individual mice (n = 4/time points for each genotype). Mann–Whitney U test. Asterisks indicate significant differences; *p < 0.05, ****p < 0.0001. Significant rhythms are illustrated with fitted cosine-wave regression using a line (significance: cos-fit p value ≤ 0.05). Details on the number of mice per time point are summarized in Supplementary Table 6

