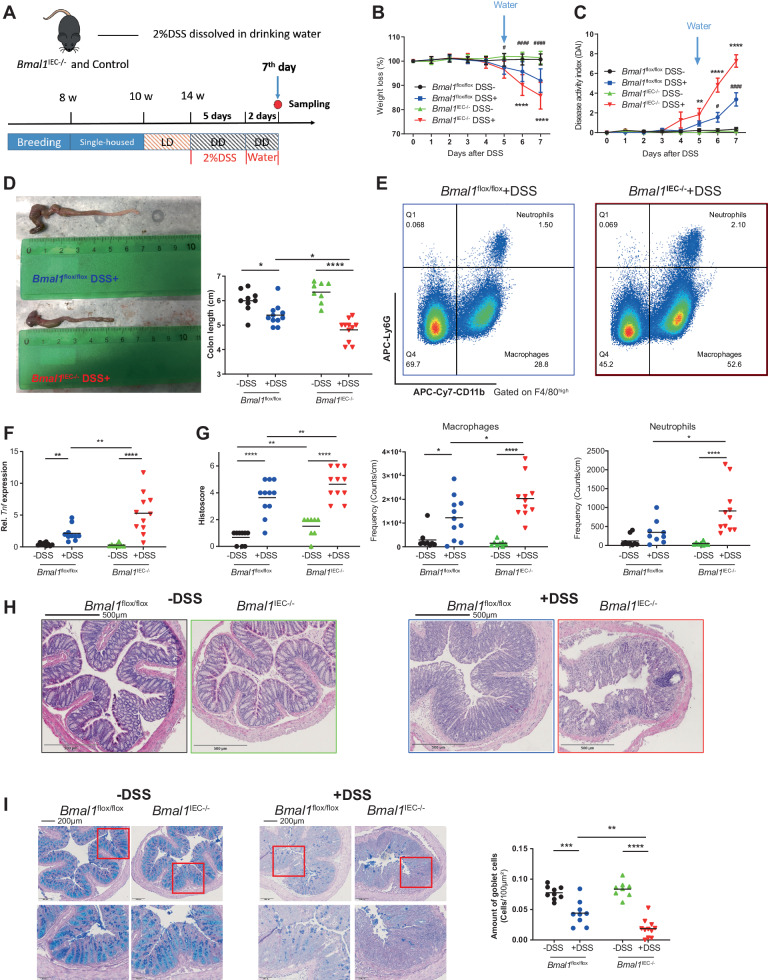
Fig. 5.
Bmal1IEC−/− mice are more susceptible to DSS-induced colitis. A Schematic illustration of the DSS treatment procedure. Body weight changes B and disease activity indices C of control and Bmal1IEC−/− mice during DSS/water administration. D Representative images of the colon (left) and colon length measurements (right). E Gating strategy for macrophages and neutrophils in the colon LP and quantification. Tnf expression in colon tissues F, histopathological scores G, representative H&E staining H and PAS-AB staining quantification of the number of goblet cells based on a minimum of 20 crypts for each section I of colon sections from control and Bmal1IEC−/− mice with/without DSS treatment. The data points represent individual mice (n > 8 for each group). Two-way ANOVA and Benjamini‒Hochberg correction were used. Asterisks indicate significant differences between genotypes after DSS treatment; *p < 0.05, **p < 0.01, ***p < 0.001, ****p < 0.0001. Octothorpes indicate significant differences between Bmal1flox/flox mice after treatment (#p < 0.05, ##p < 0.01, ###p < 0.001). Details on the number of mice per time point are summarized in Supplementary Table 6

