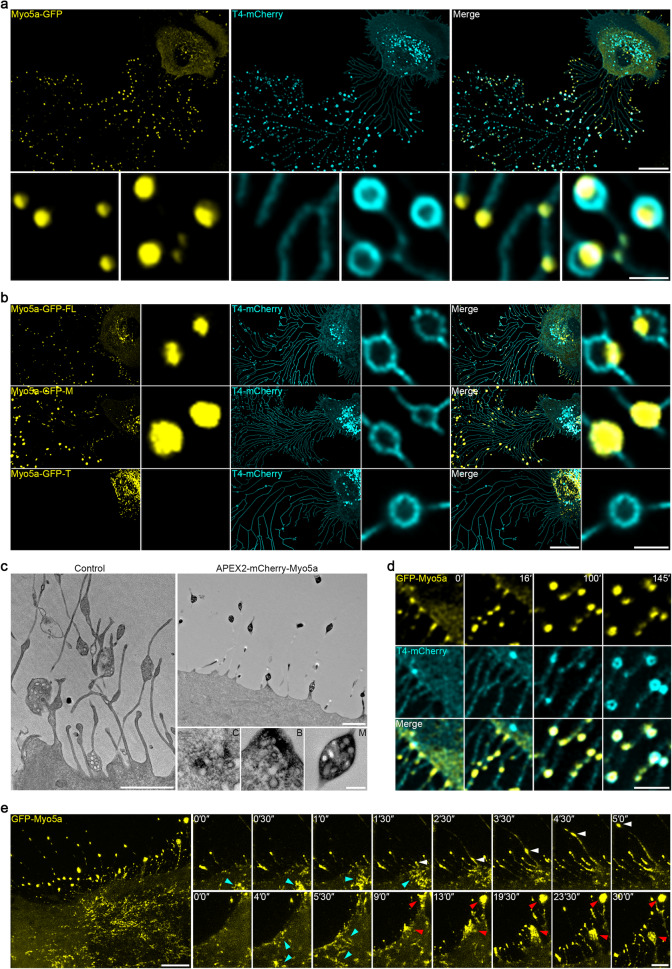
Fig. 3. Myosin-5a is actively transported into the migrasome.
a Confocal images of L929 cells stably expressing Myosin-5a (Myo5a-GFP) and T4-mCherry. Scale bar, 20 µm. Lower panels, enlarged ROI. Scale bar, 2 µm. b Confocal images of L929-T4-mCherry cells stably expressing the indicated forms of Myo5a: full-length (FL), motor domain (M) and tail domain (T). Scale bar, 20 µm. Right panels, enlarged ROI. Scale bar, 2 µm. c APEX2-based TEM images of L929 cells stably expressing APEX2-mCherry-Myo5a. Scale bar, 2 µm. The lower panels show higher-magnification images of vesicles from the cell body (C), the base of a retraction fiber (B) and the migrasome (M). Scale bar, 200 nm. d Time-lapse images of L929 cells stably expressing GFP-Myo5a and T4-mCherry. Time interval, 90 s. Scale bar, 5 µm. e GI-SIM images of L929-GFP-Myo5a cells. Time-lapse images were acquired at intervals of 30 s. Scale bar, 5 µm. Right panels, enlarged ROI. Blue arrowheads indicate Myo5a transporting to the edge of the cell. White arrowheads indicate Myo5a moving into migrasomes. Red arrowheads indicate Myo5a accumulating at the edge of cell and left on retraction fibers. Scale bar, 2 µm.

