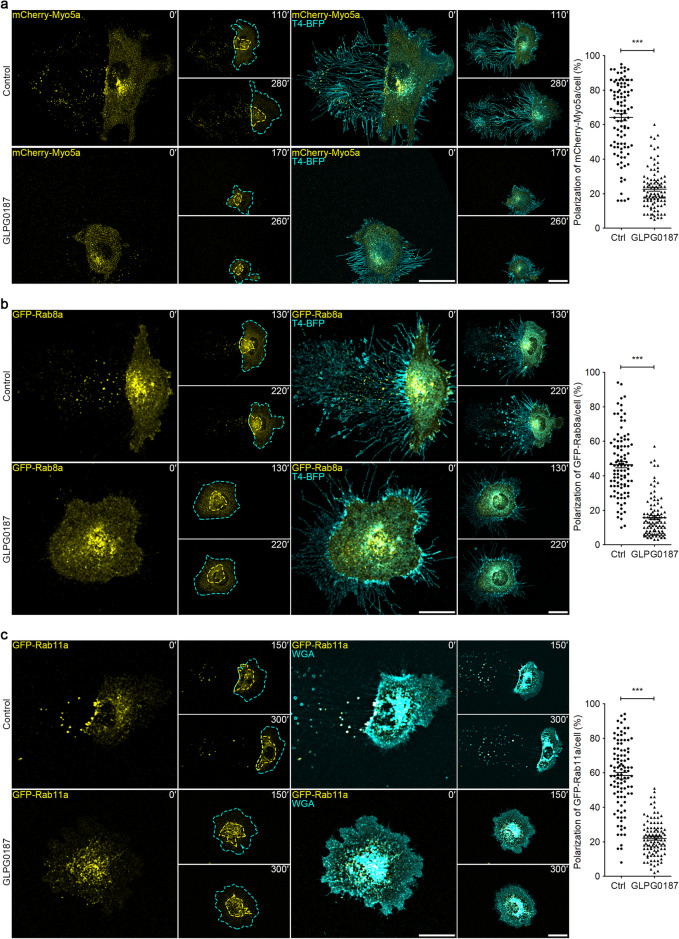
Fig. 5. Cell migration causes the polarization of secretory carriers to the rear end of the cell.
a L929 cells stably expressing mCherry-Myo5a and T4-BFP, treated with or without 10 μM GLPG0187, were subjected to time-lapse imaging. Time interval, 10 min. Cyan dashed lines outline the cell body, and yellow dashed lines outline mCherry-Myo5a puncta. Scale bar, 20 μm. Polarization of mCherry-Myo5a was quantified and shown as the means ± SEM for triplicate samples of > 50 cells. Two-tailed unpaired t-test was used for statistical analyses (right panel). ***P < 0.001. b L929 cells stably expressing GFP-Rab8a and T4-BFP, treated with or without 10 μM GLPG0187, were subjected to time-lapse imaging. Time interval, 10 min. Cyan dashed lines outline the cell body, and yellow dashed lines outline GFP-Rab8a vesicles, respectively. Scale bar, 20 μm. Polarization of GFP-Rab8a was quantified and shown as the means ± SEM for triplicate samples of > 50 cells. Two-tailed unpaired t-test was used for statistical analyses (right panel). ***P < 0.001. c L929 cells stably expressing GFP-Rab11a, treated with or without 10 μM GLPG0187, were stained with wheat germ agglutinin (WGA) and then subjected to time-lapse imaging. Time interval, 10 min. Cyan dashed lines outline the cell body, and yellow dashed lines outline GFP-Rab11a vesicles, respectively. Scale bar, 20 μm. Polarization of GFP-Rab11a was quantified and shown as the means ± SEM for triplicate samples of > 50 cells. Two-tailed unpaired t-test was used for statistical analyses (right panel). ***P < 0.001.

