Fig. 1.
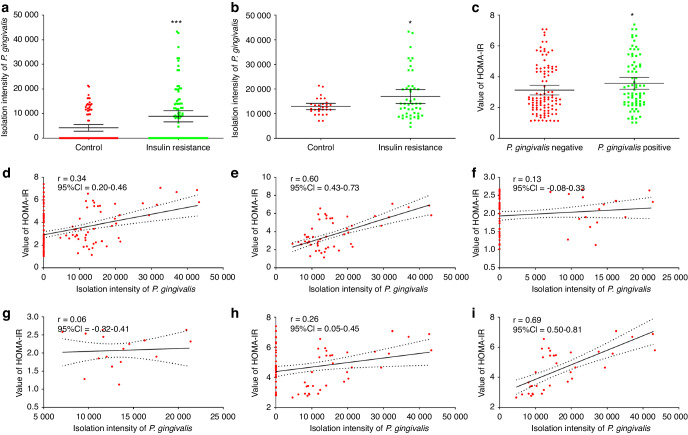
Clinical isolation of P. gingivalis is significantly correlated with IR. a Comparison of the amount of P. gingivalis isolated between the control and IR groups (mean and 95% CI). b Comparison of the amount of P. gingivalis isolated from P. gingivalis-positive samples between the control and IR groups (mean and 95% CI). c Comparison of HOMA-IR scores between P. gingivalis-positive and P. gingivalis-negative participants (mean and 95% CI). Correlation analysis between the amount of P. gingivalis isolated and the HOMA-IR score among the overall participants (d) and the P. gingivalis-positive participants (e). Correlation analysis between the amount of P. gingivalis isolated and the HOMA-IR score in the control group (f) and among P. gingivalis-positive participants in the control group (g). Correlation analysis between the amount of P. gingivalis isolated and the HOMA-IR score in the IR group (h) and among the P. gingivalis-positive participants in the IR group (i). IR, insulin resistance; r, correlation coefficient; CI, confidence interval; HOMA-IR: homeostatic model assessment for insulin resistance; *P < 0.05; ***P < 0.001

